Presentation Design

Overview

My work in presentation design has entailed page layout, art development, and photo curation. In addition to designing slides, I have organized and edited content to help clients convey their message. I can hone rough ideas into compelling presentations. Understanding the importance of usability, I can produce slides that clients can tailor to each delivery.

Products and Services

  • Layout of slides
  • Organization and refinement of content
  • Creation of vector art and infographics
  • Curation and correction of photos
  • Animation
  • Accessibility*

*I have modified some design examples from their original versions in order to comply with WCAG standards. Significant changes are noted in project descriptions.

Selected Work

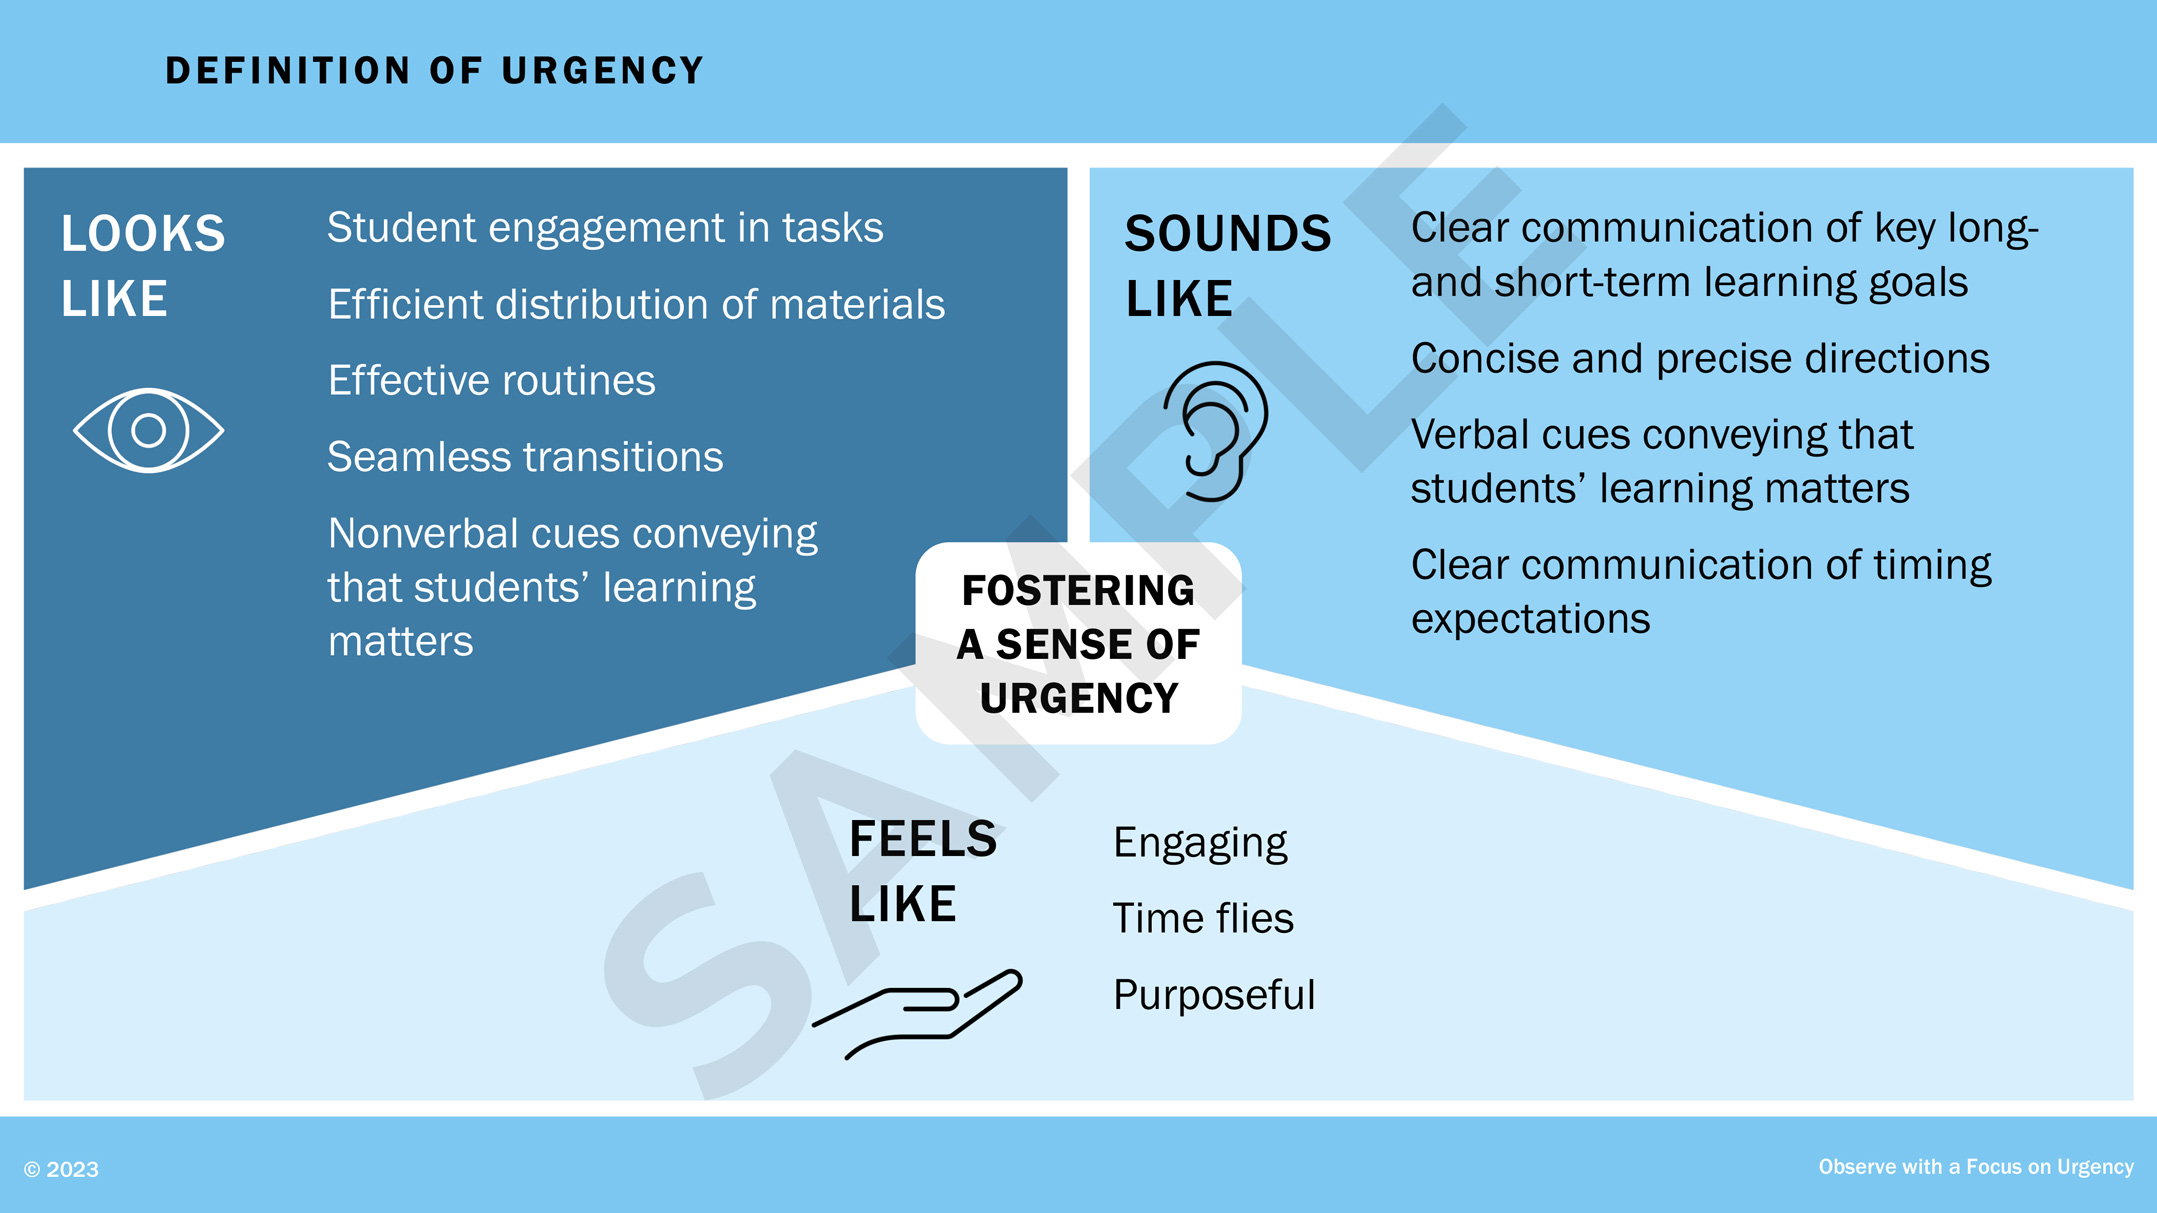
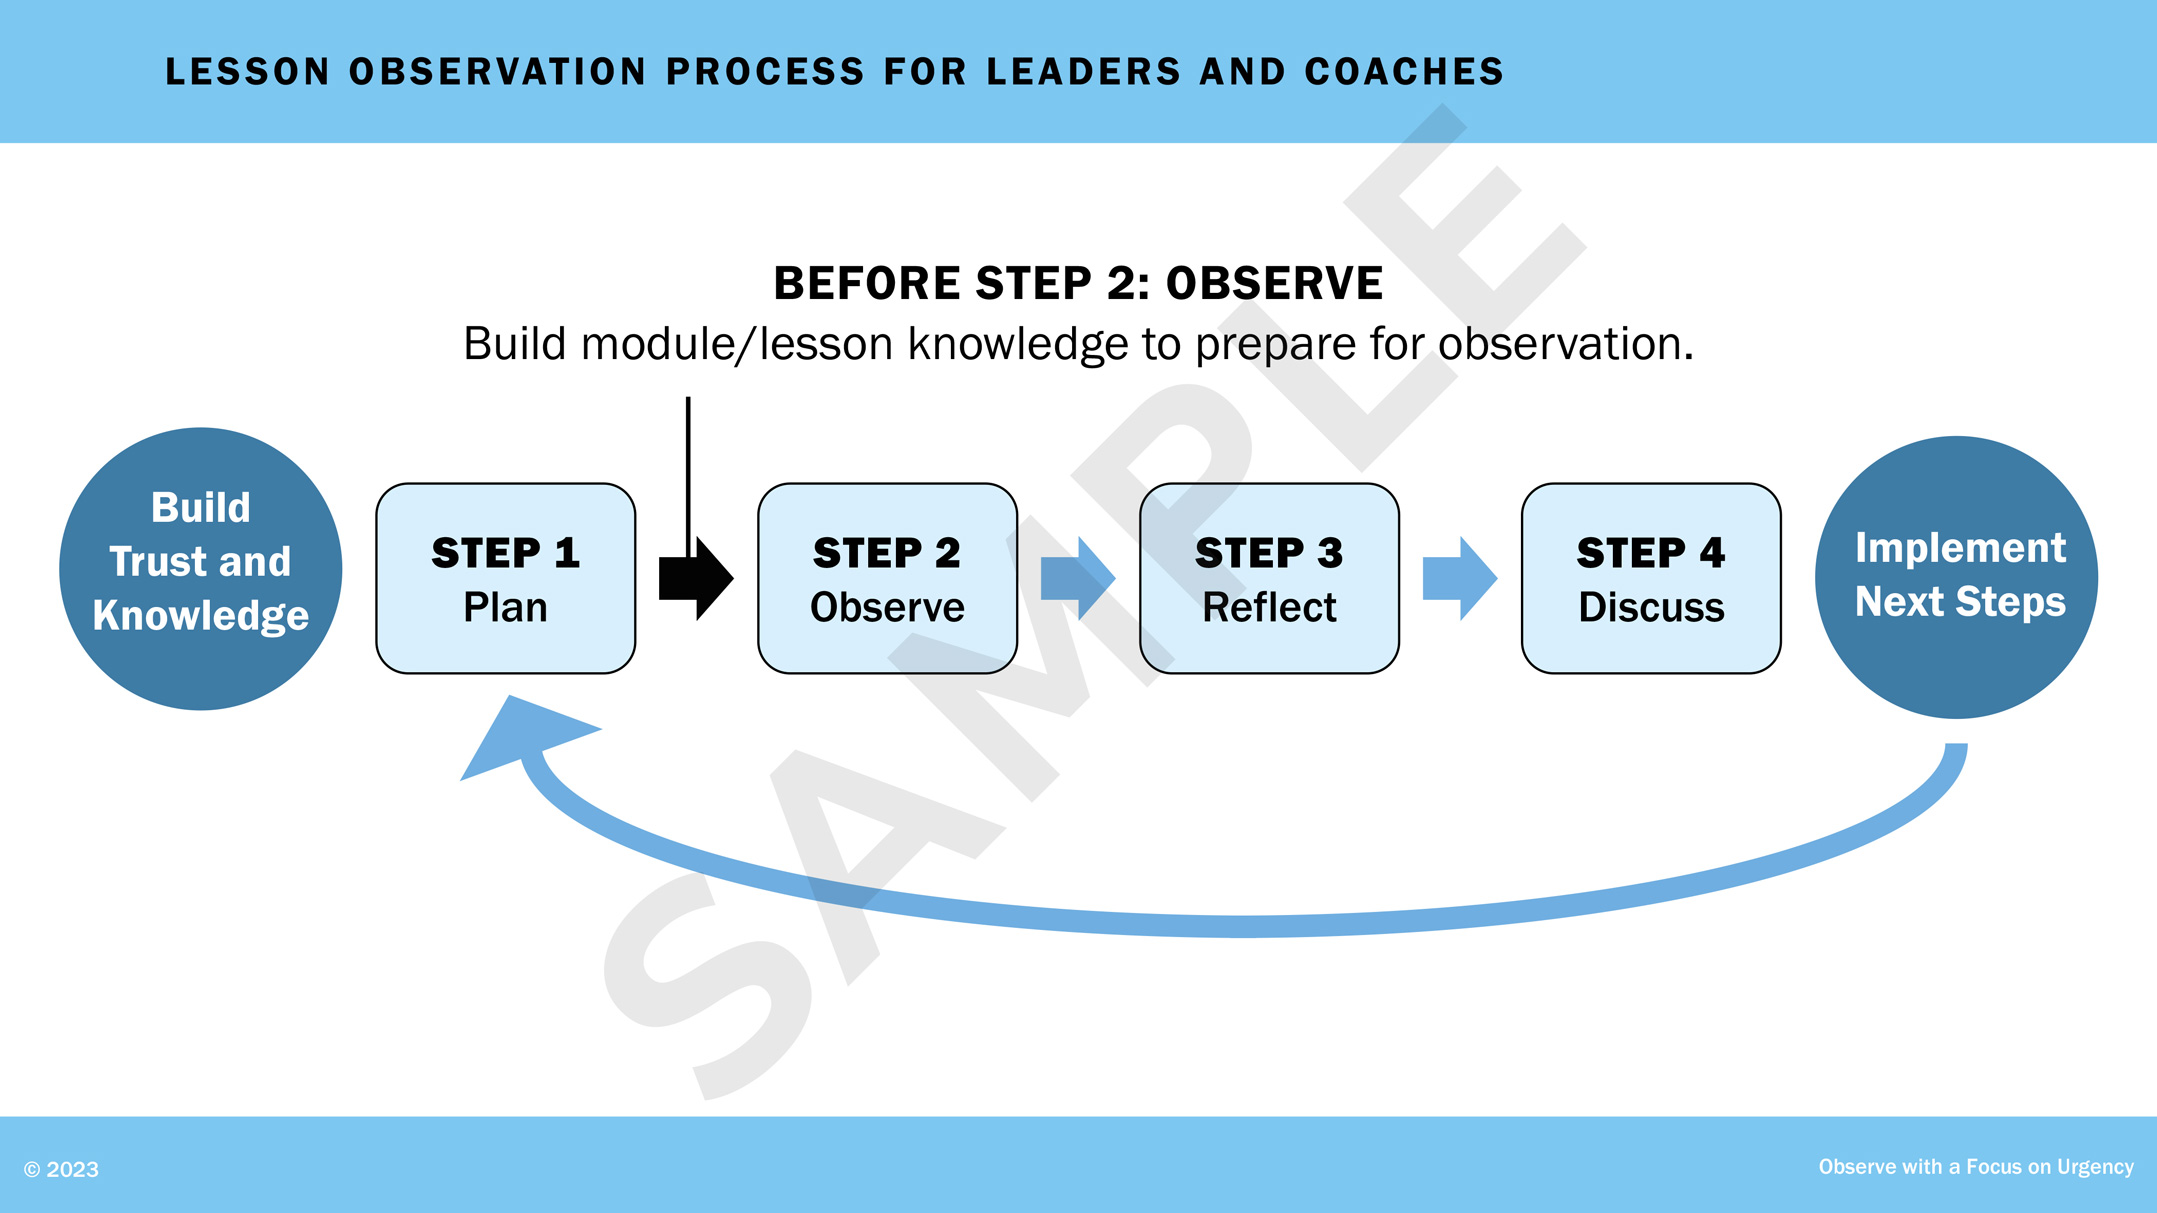
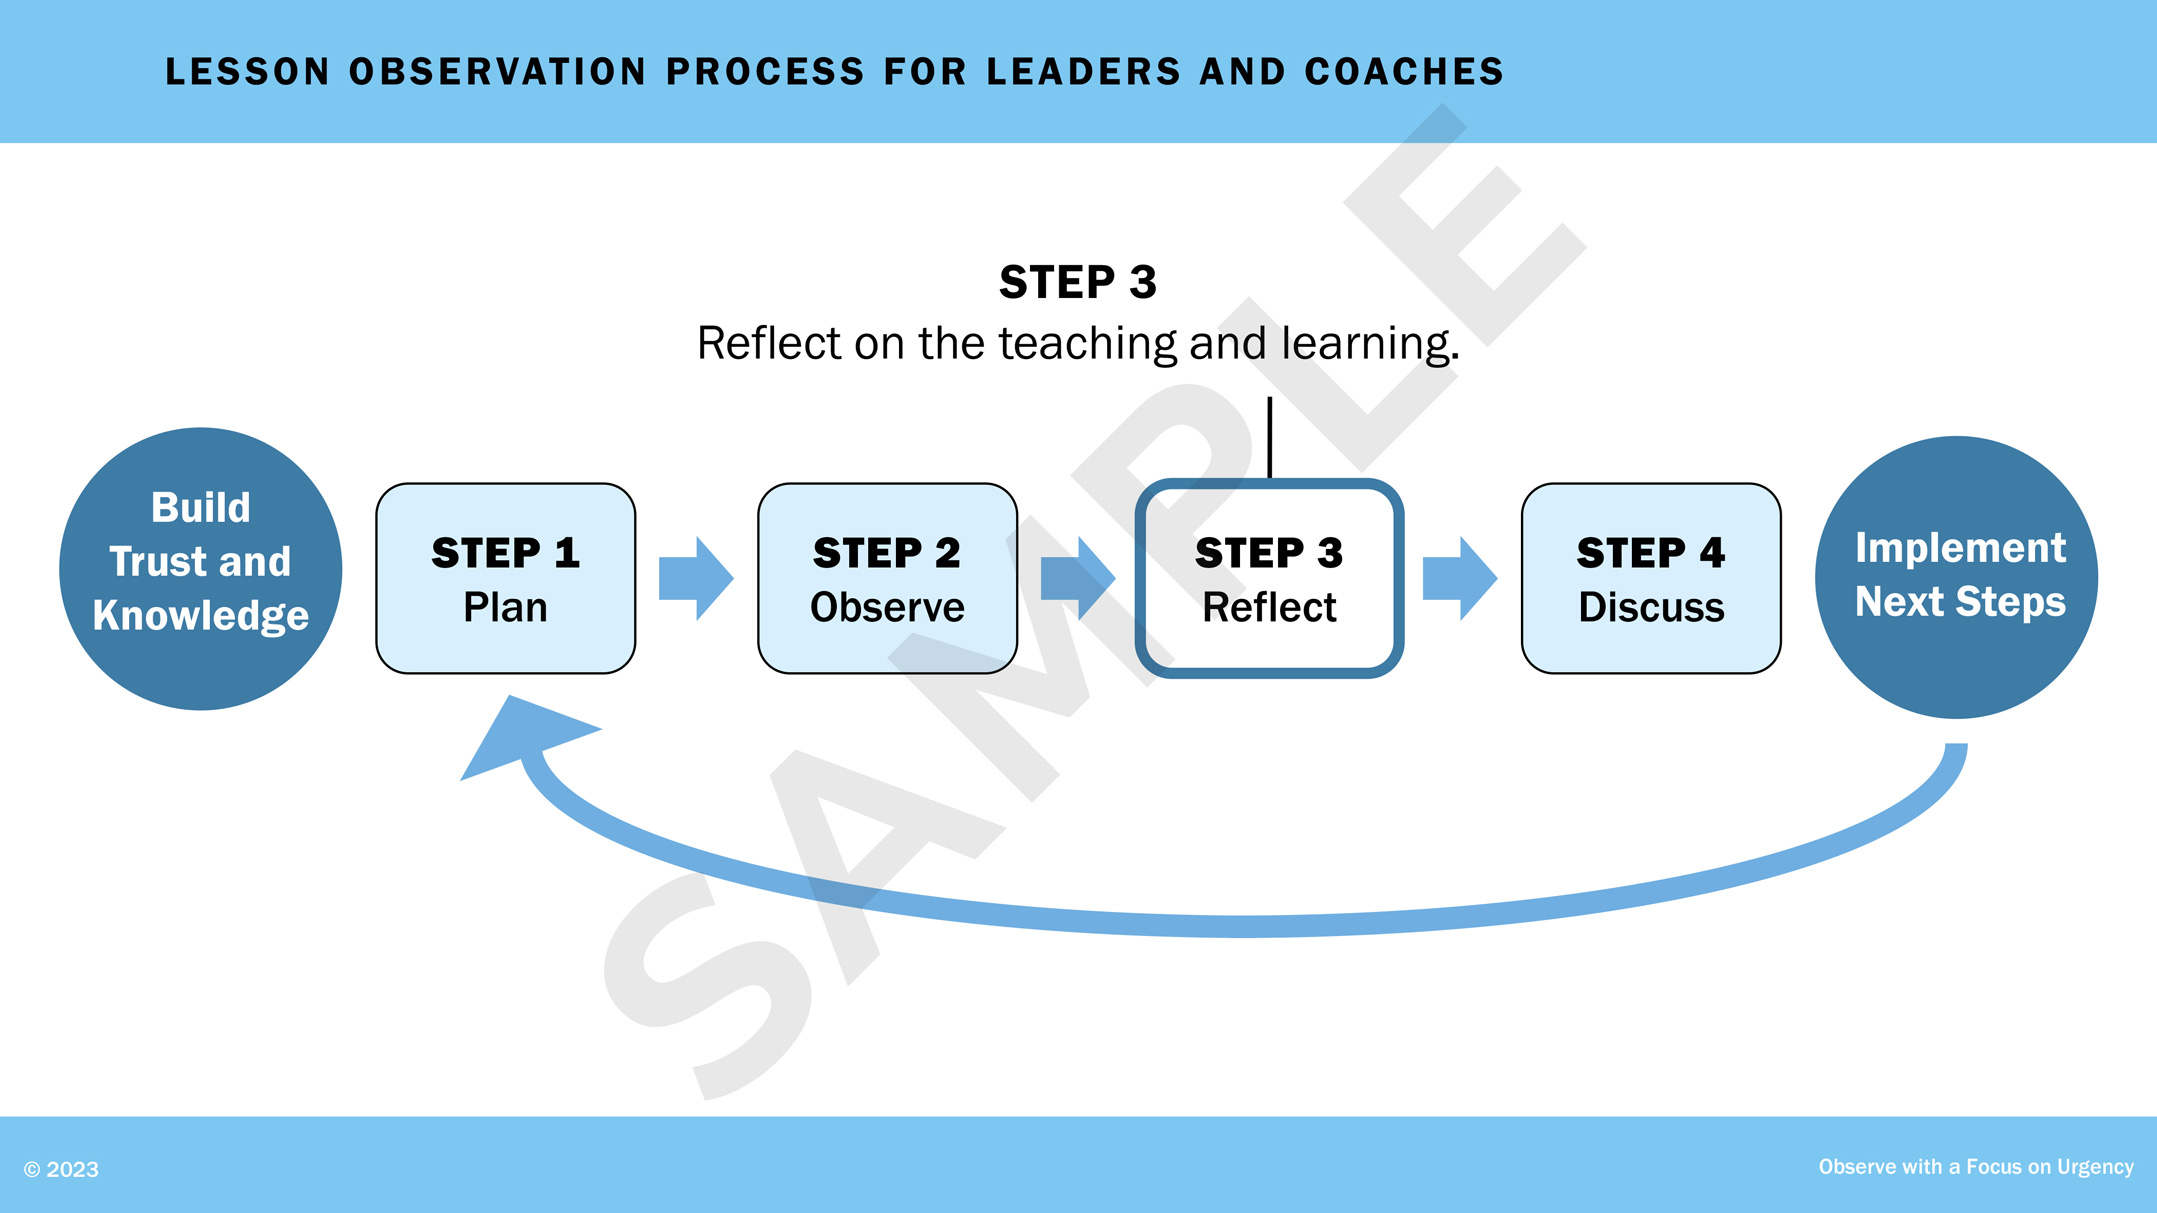
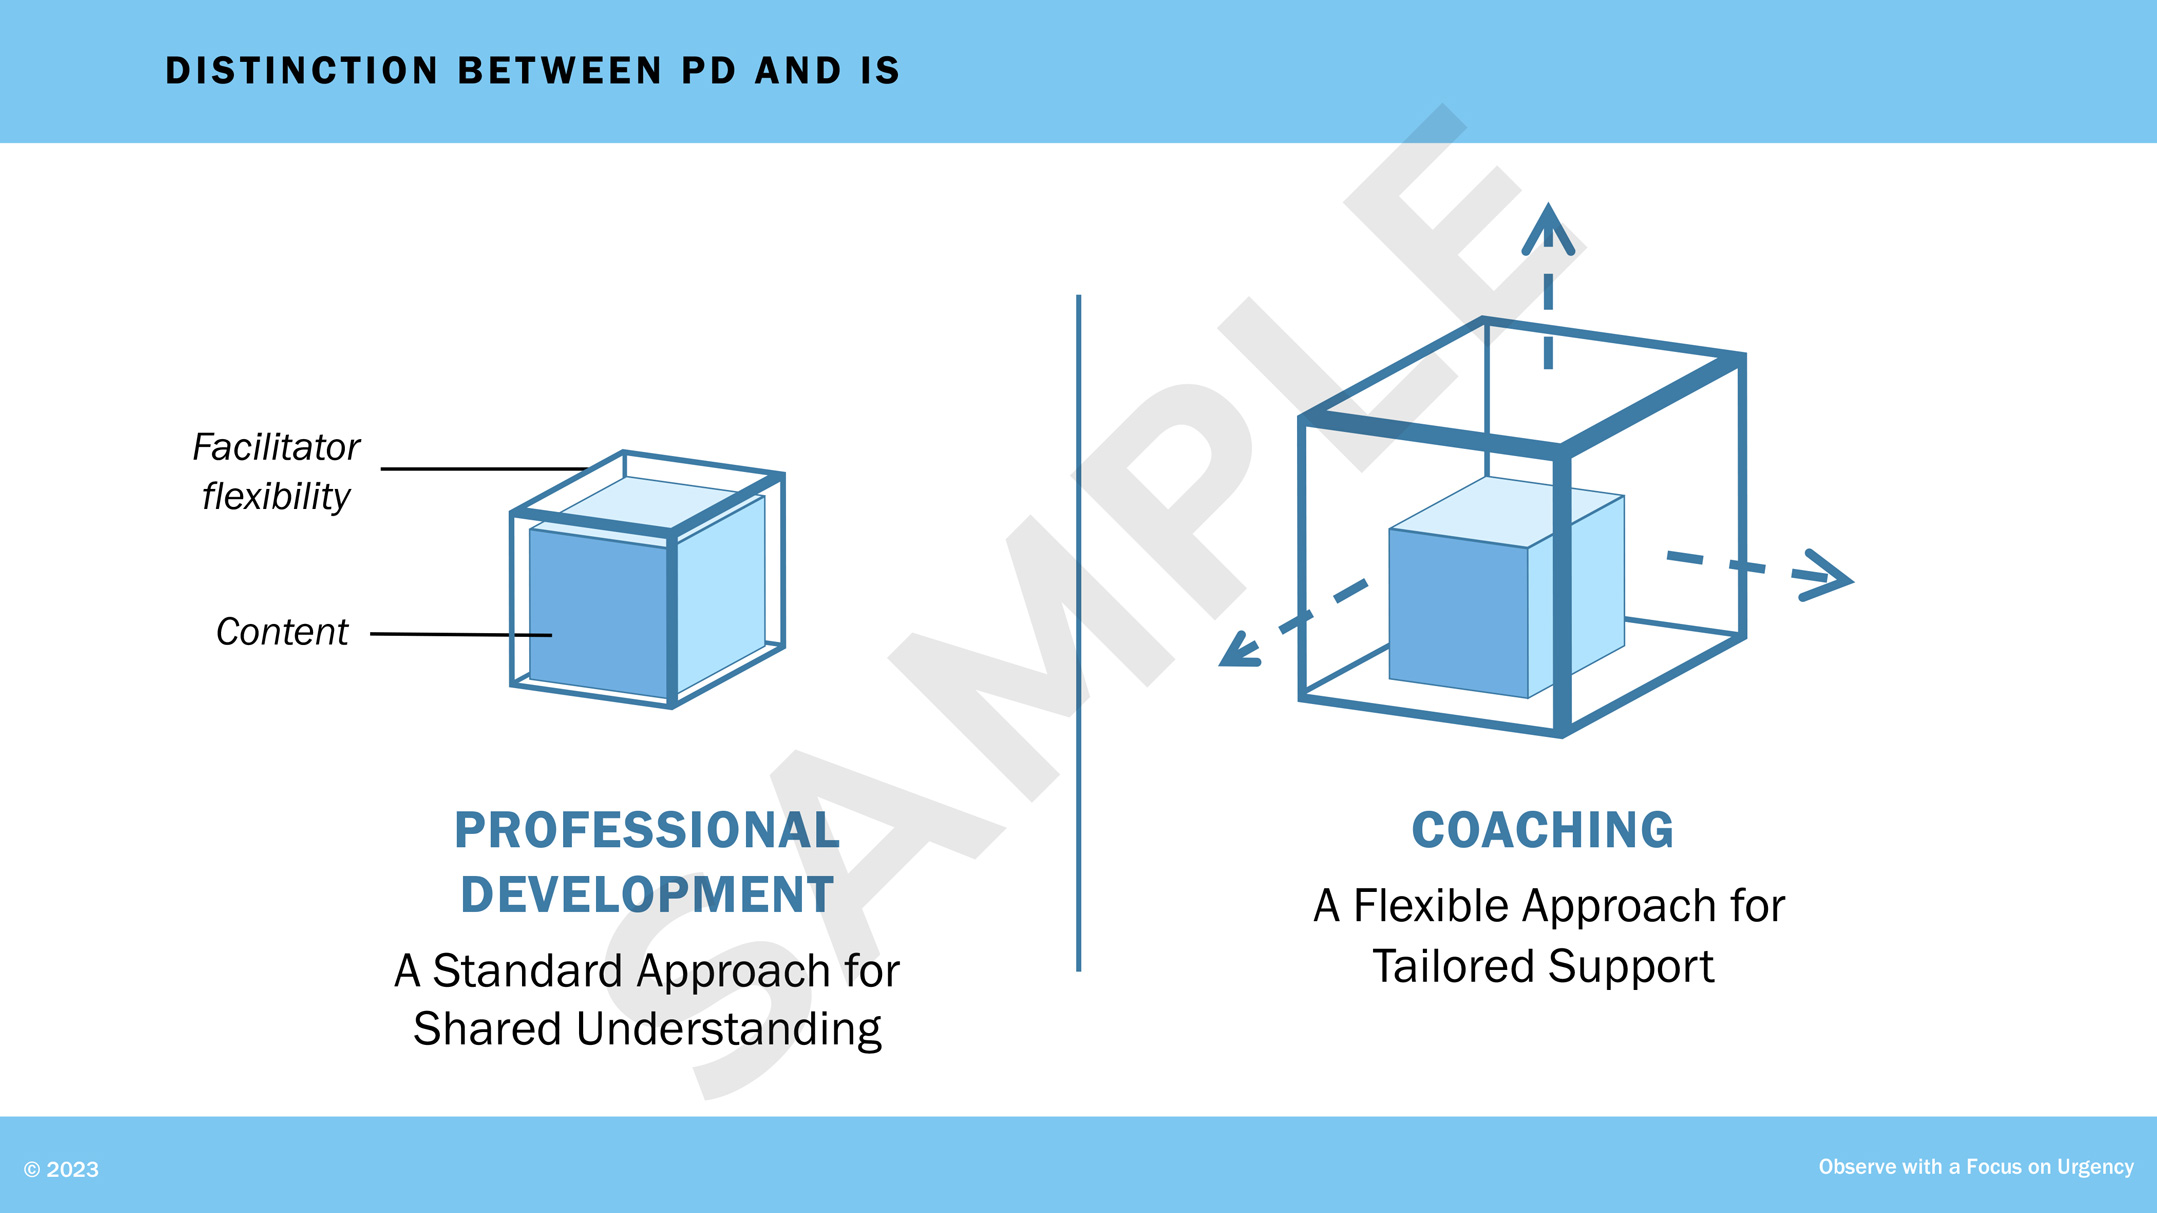
Coaching Series for Teachers

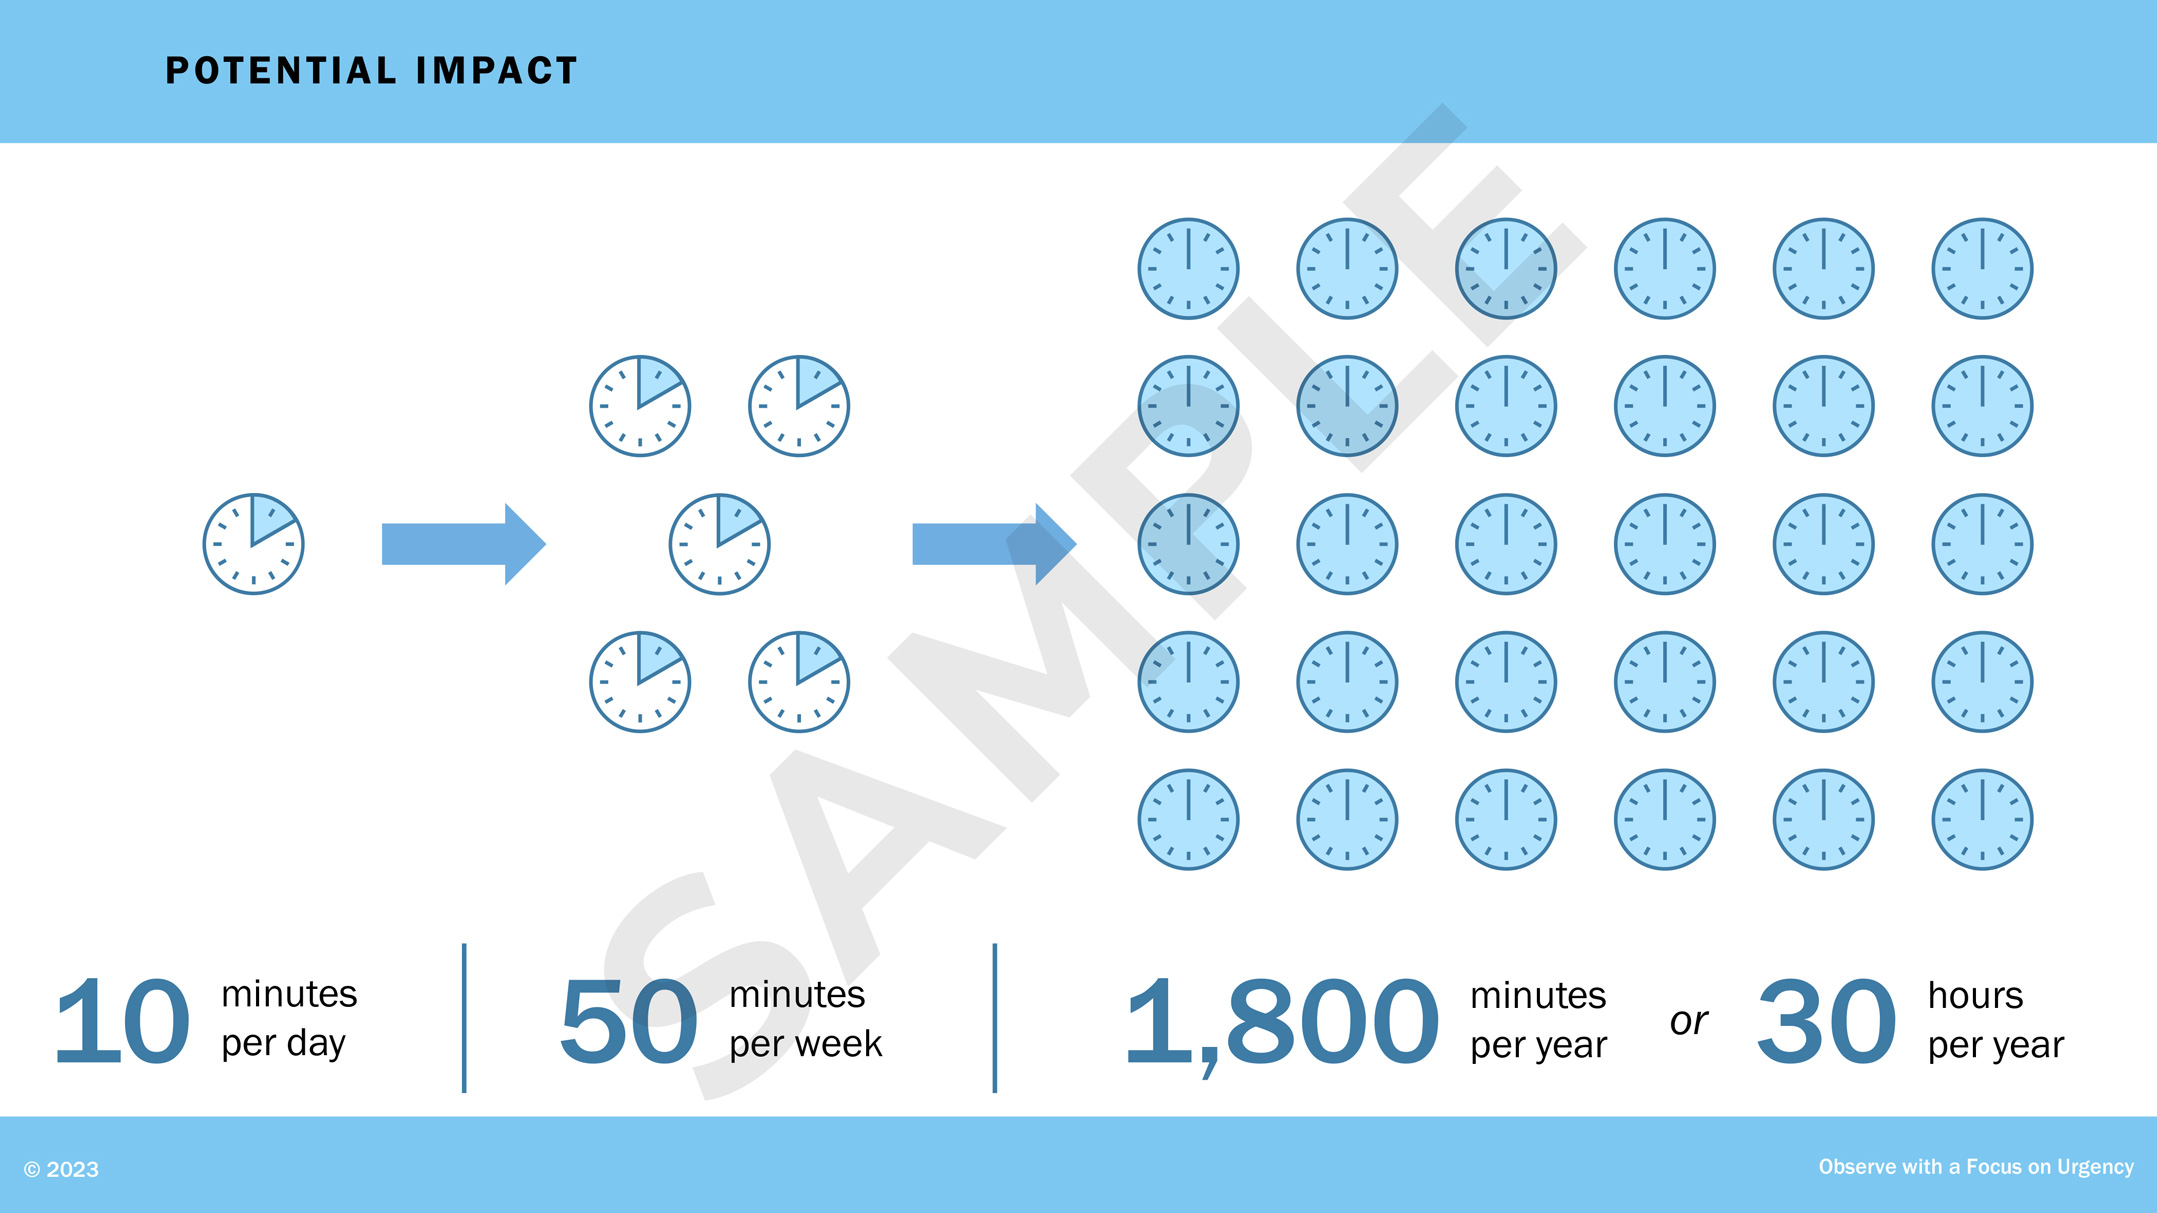
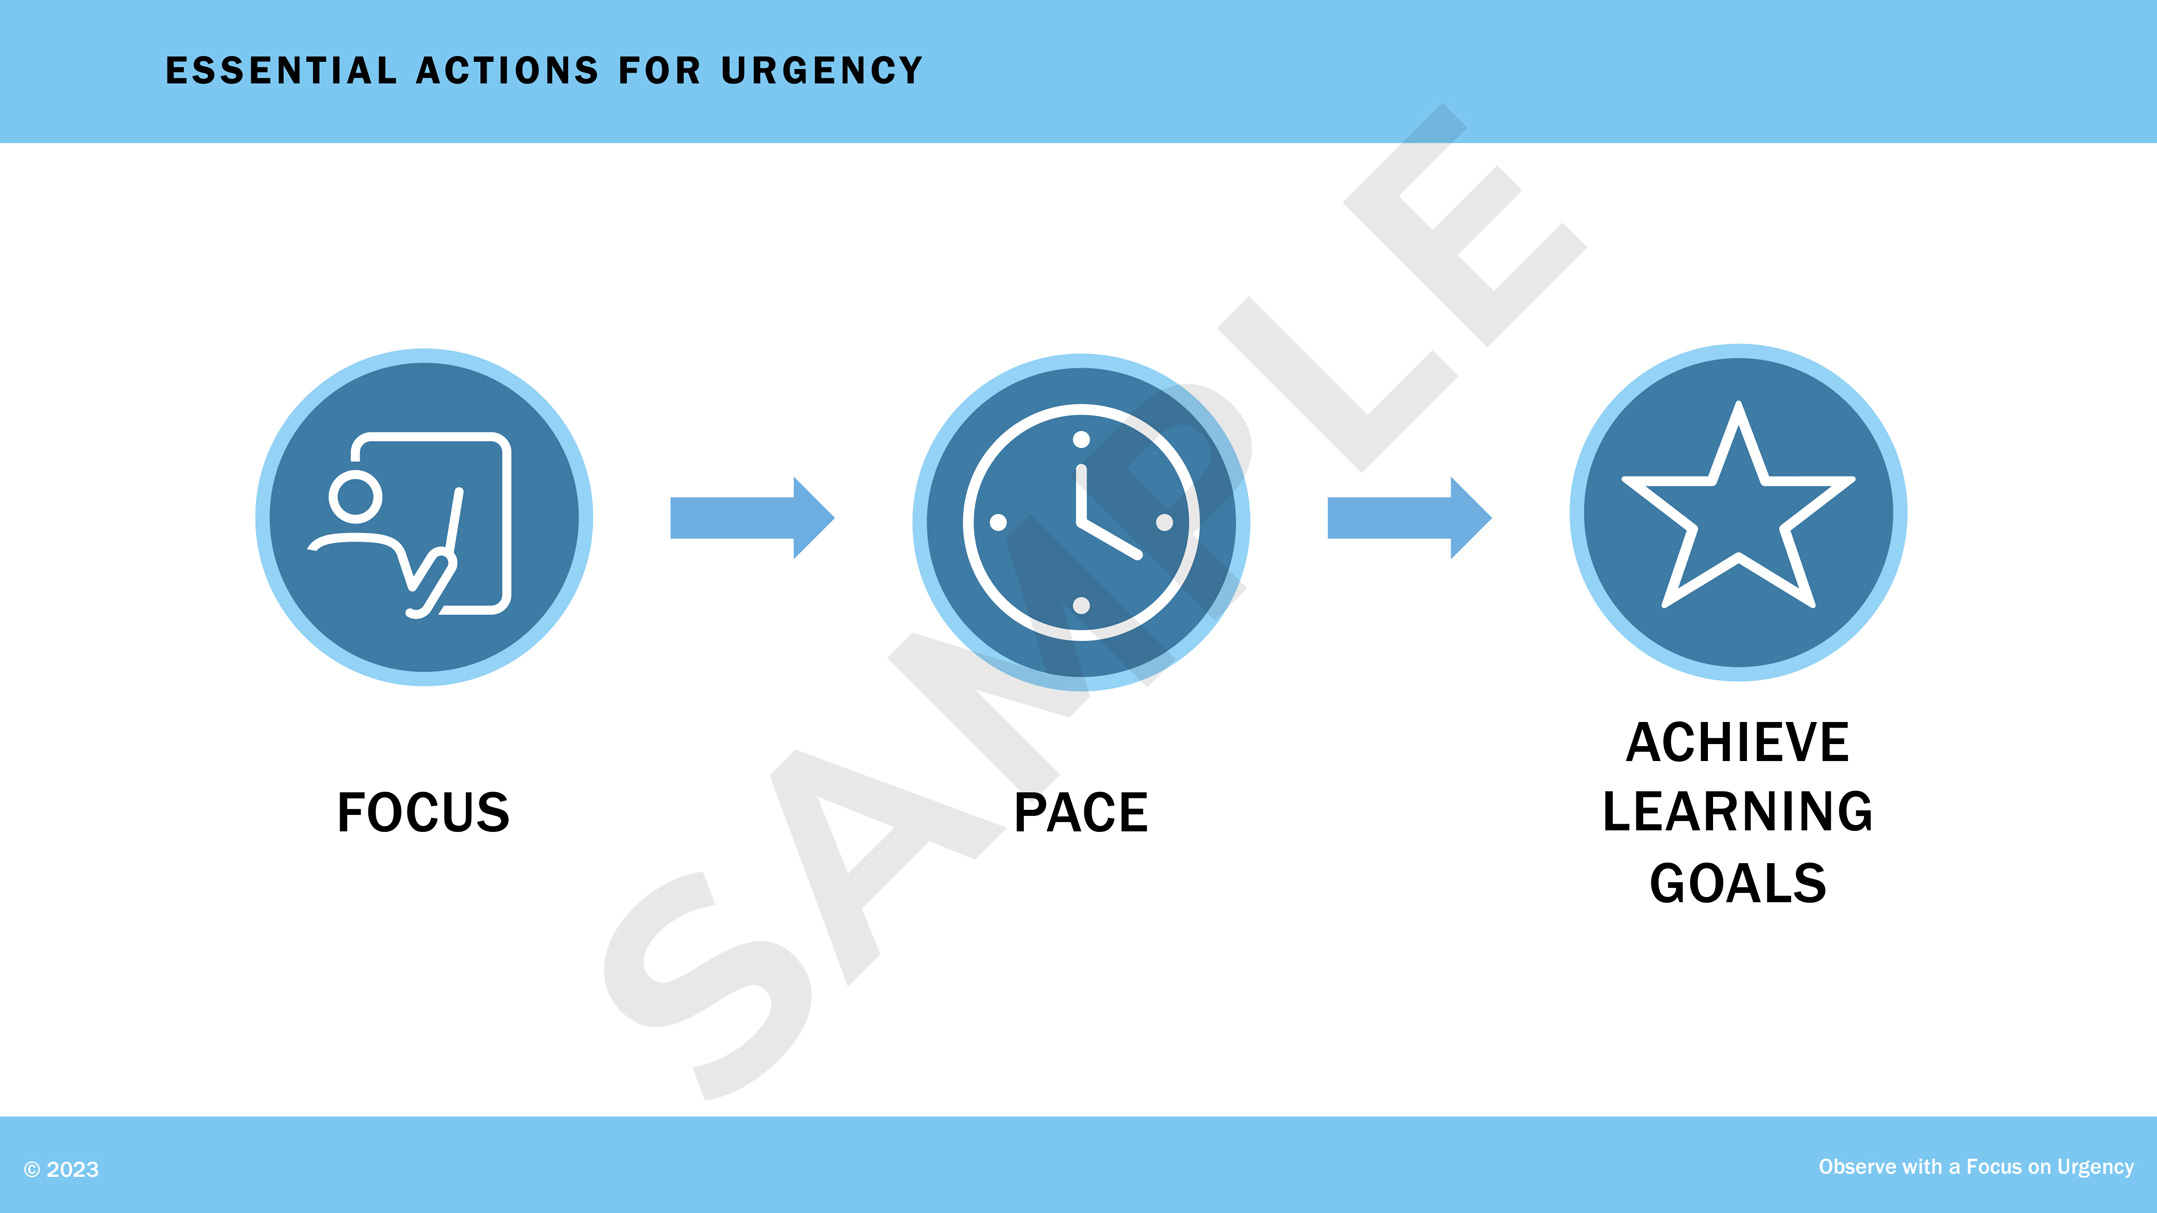
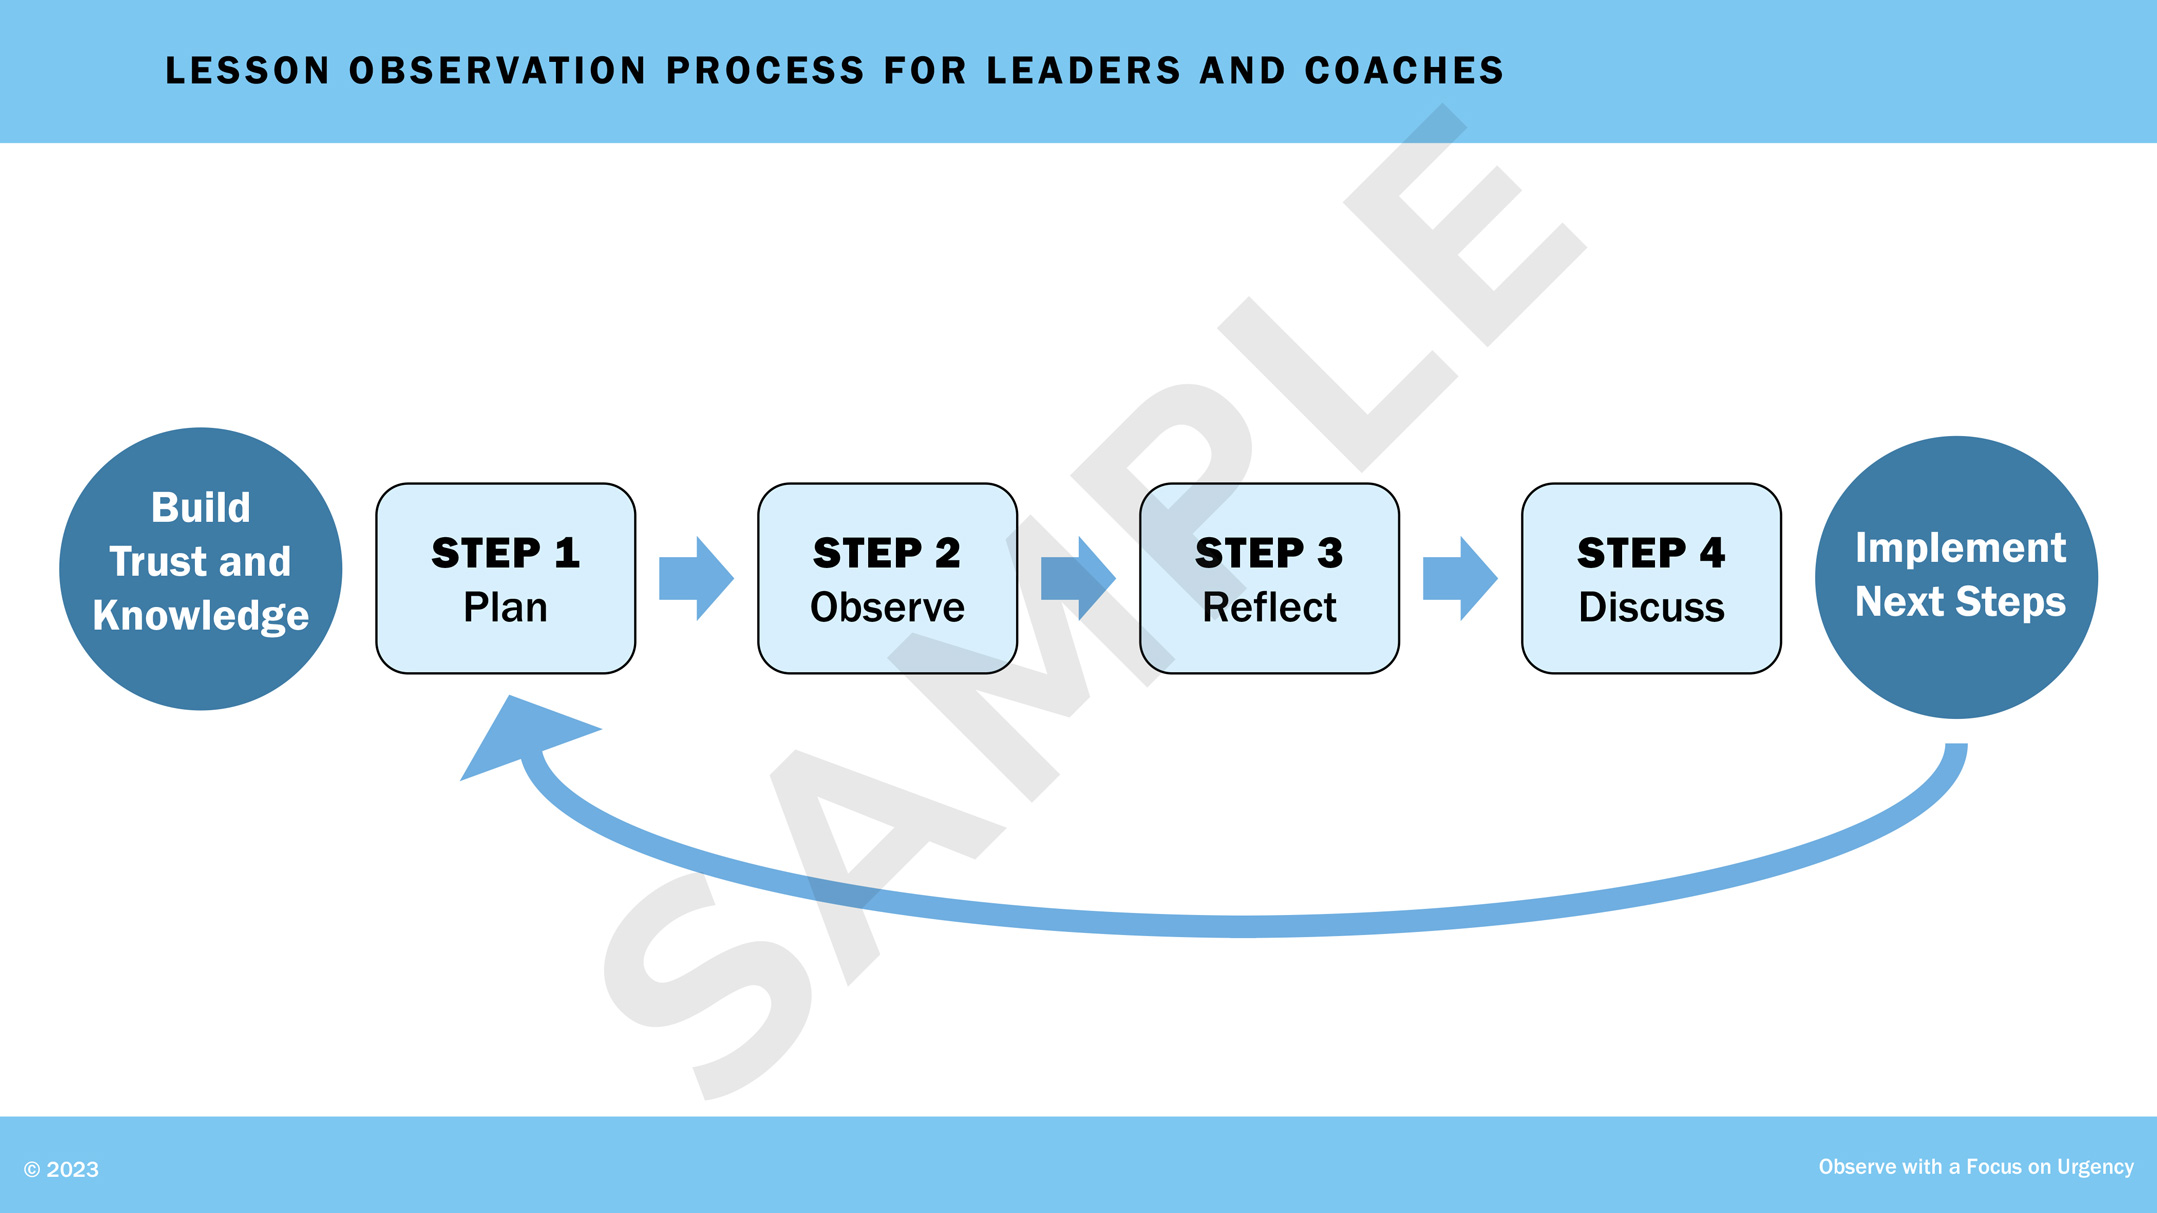
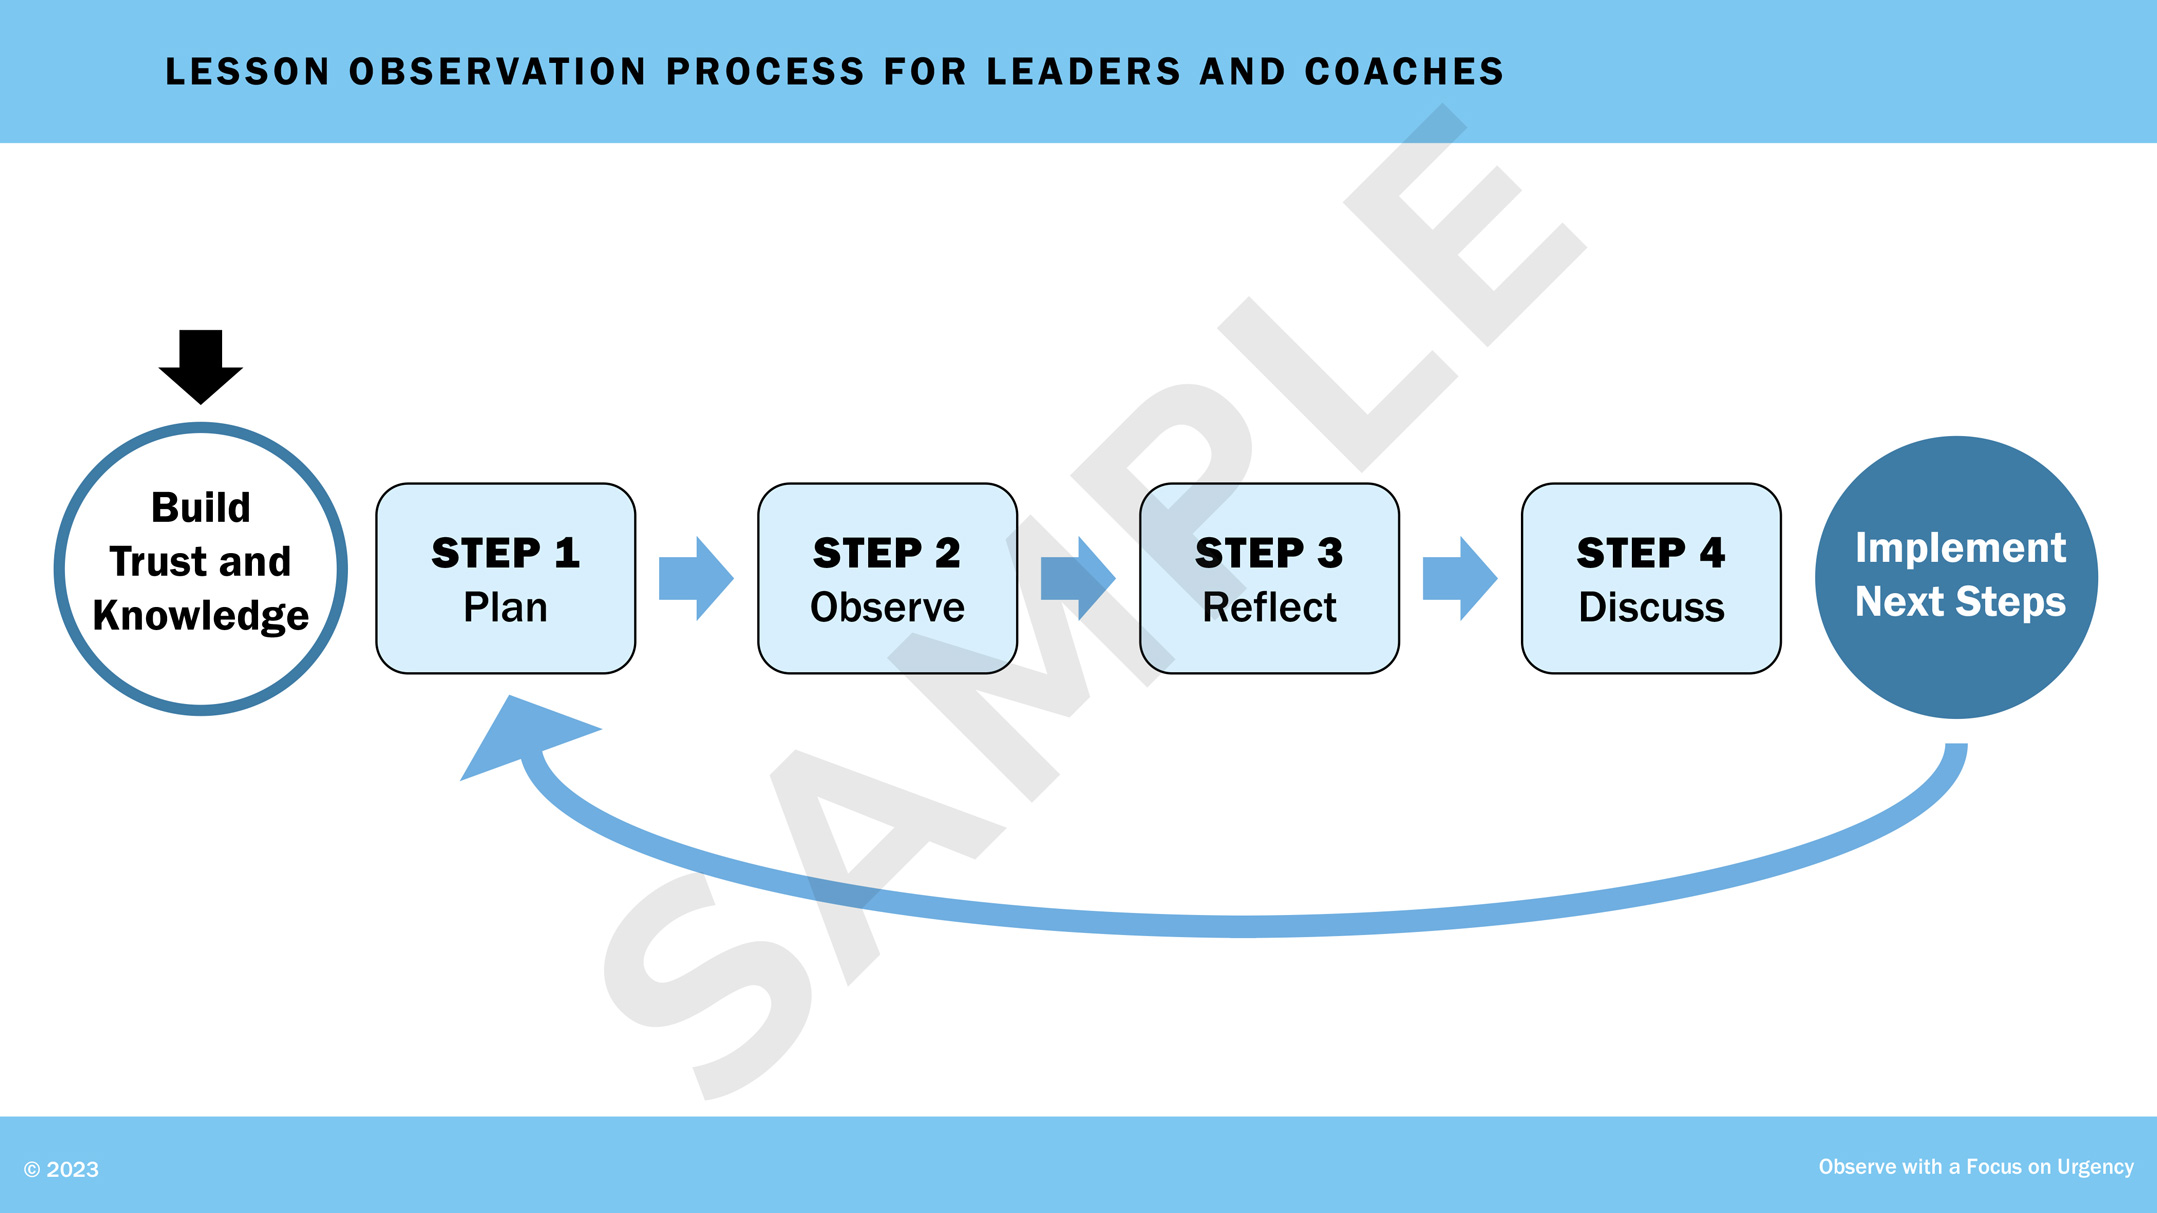
Using existing branding, I delivered a presentation design for a professional-learning series (selected slides shown; name and logo removed for anonymity). The deck elucidated the idea of urgency in teaching and outlined ways in which leaders can coach teachers effectively.

By arranging the content, creating vector graphics, and suggesting steps for animation, I helped the writers clarify their message.

See a related handout that I designed.

Slide from a PowerPoint presentation for a learning series for teachers. The infographic includes three sections that define urgency in teaching: what urgency looks like, with an icon of an eye; what urgency feels like, with an icon of an ear; and what urgency feels like, with an icon of a hand. Text accompanies each section. Slide from a PowerPoint presentation for a learning series for teachers. The infographic includes clock icons to represent the impact of urgency in teaching in minutes per day, week, and year. Slide from a PowerPoint presentation for a learning series for teachers. A flow chart shows the essential actions for urgency in teaching: focus, with an icon of a teacher at the board; pace, with an icon of a clock; and achievement of learning goals, with a star. Slide from a PowerPoint presentation for a learning series for teachers. A flow chart shows the steps in the lesson observation process: build trust and knowledge, plan, observe, reflect, discuss, and implement next steps. Slide from a PowerPoint presentation for a learning series for teachers. A flow chart shows the steps in the lesson observation process: build trust and knowledge, plan, observe, reflect, discuss, and implement next steps. The step of 'build trust and knowledge' is highlighted. Slide from a PowerPoint presentation for a learning series for teachers. A flow chart shows the steps in the lesson observation process: build trust and knowledge, plan, observe, reflect, discuss, and implement next steps. The arrow between 'plan' and 'observe' is highlighted, emphasizing the importance of building knowledge of the lesson to prepare for observation. Slide from a PowerPoint presentation for a learning series for teachers. A flow chart shows the steps in the lesson observation process: build trust and knowledge, plan, observe, reflect, discuss, and implement next steps. The step of 'reflect' is highlighted. Slide from a PowerPoint presentation for a learning series for teachers. An infographic shows the difference between professional development and coaching. A cube within a snug container represents professional development. A cube within a container that is large and expanding represents coaching; arrows pointing outward represent expansion.

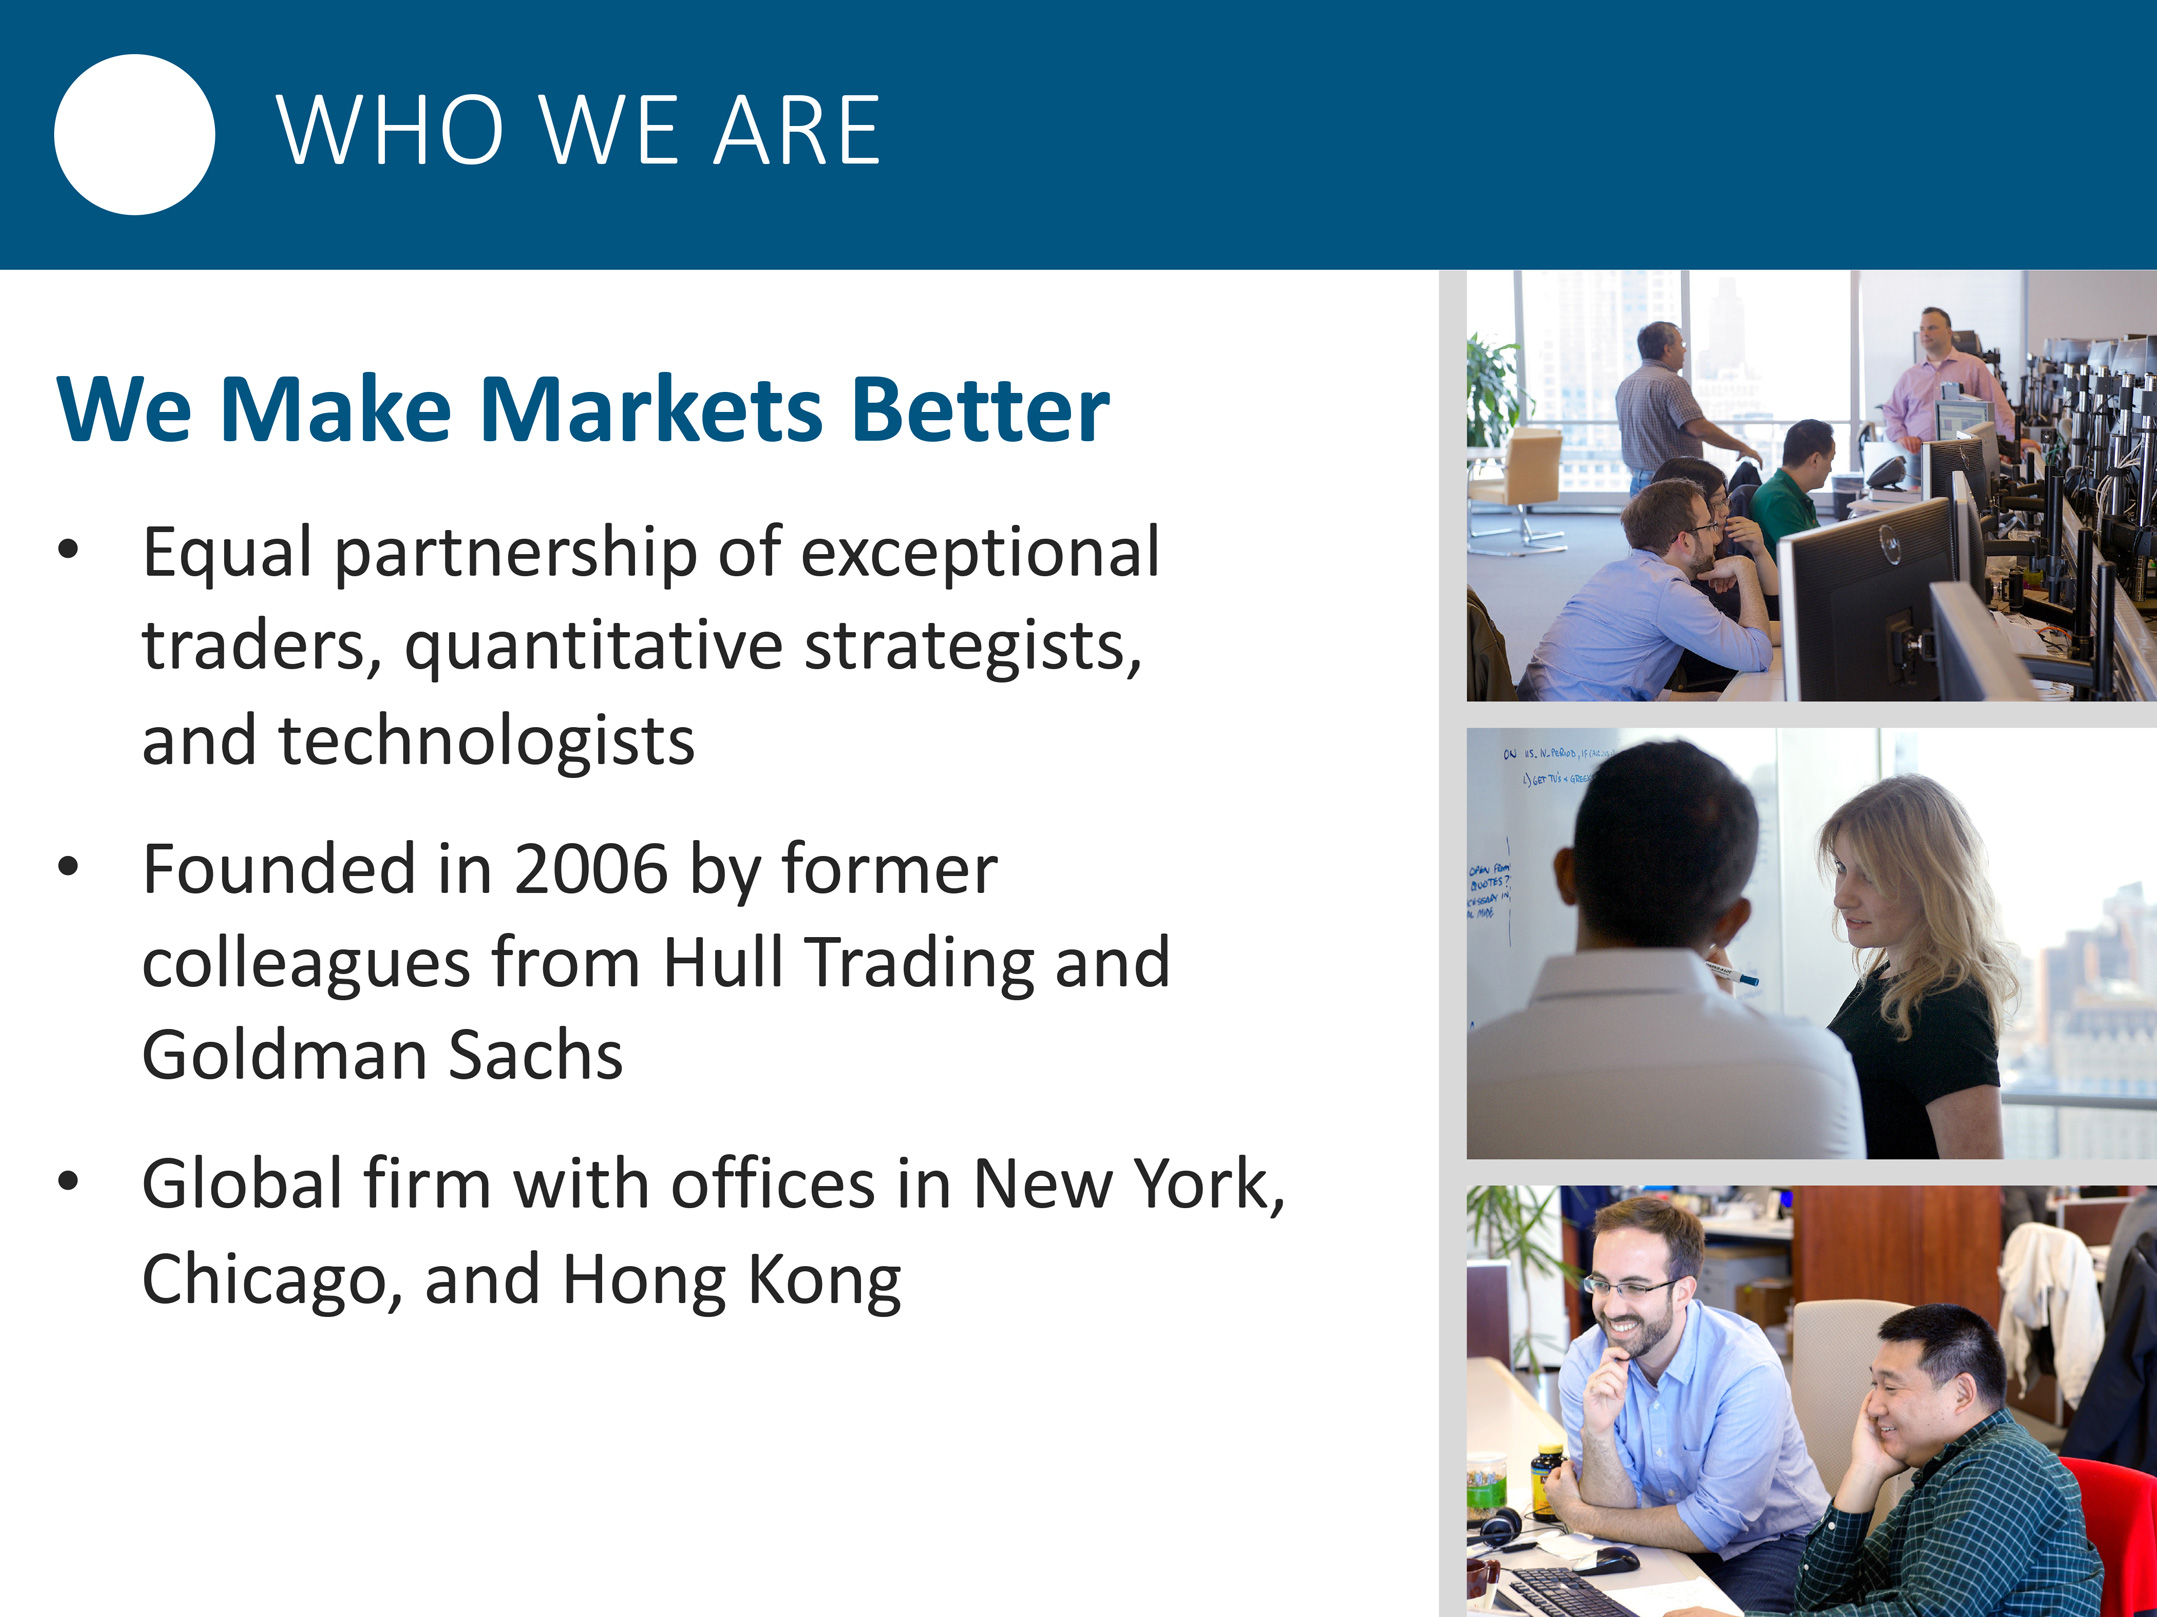
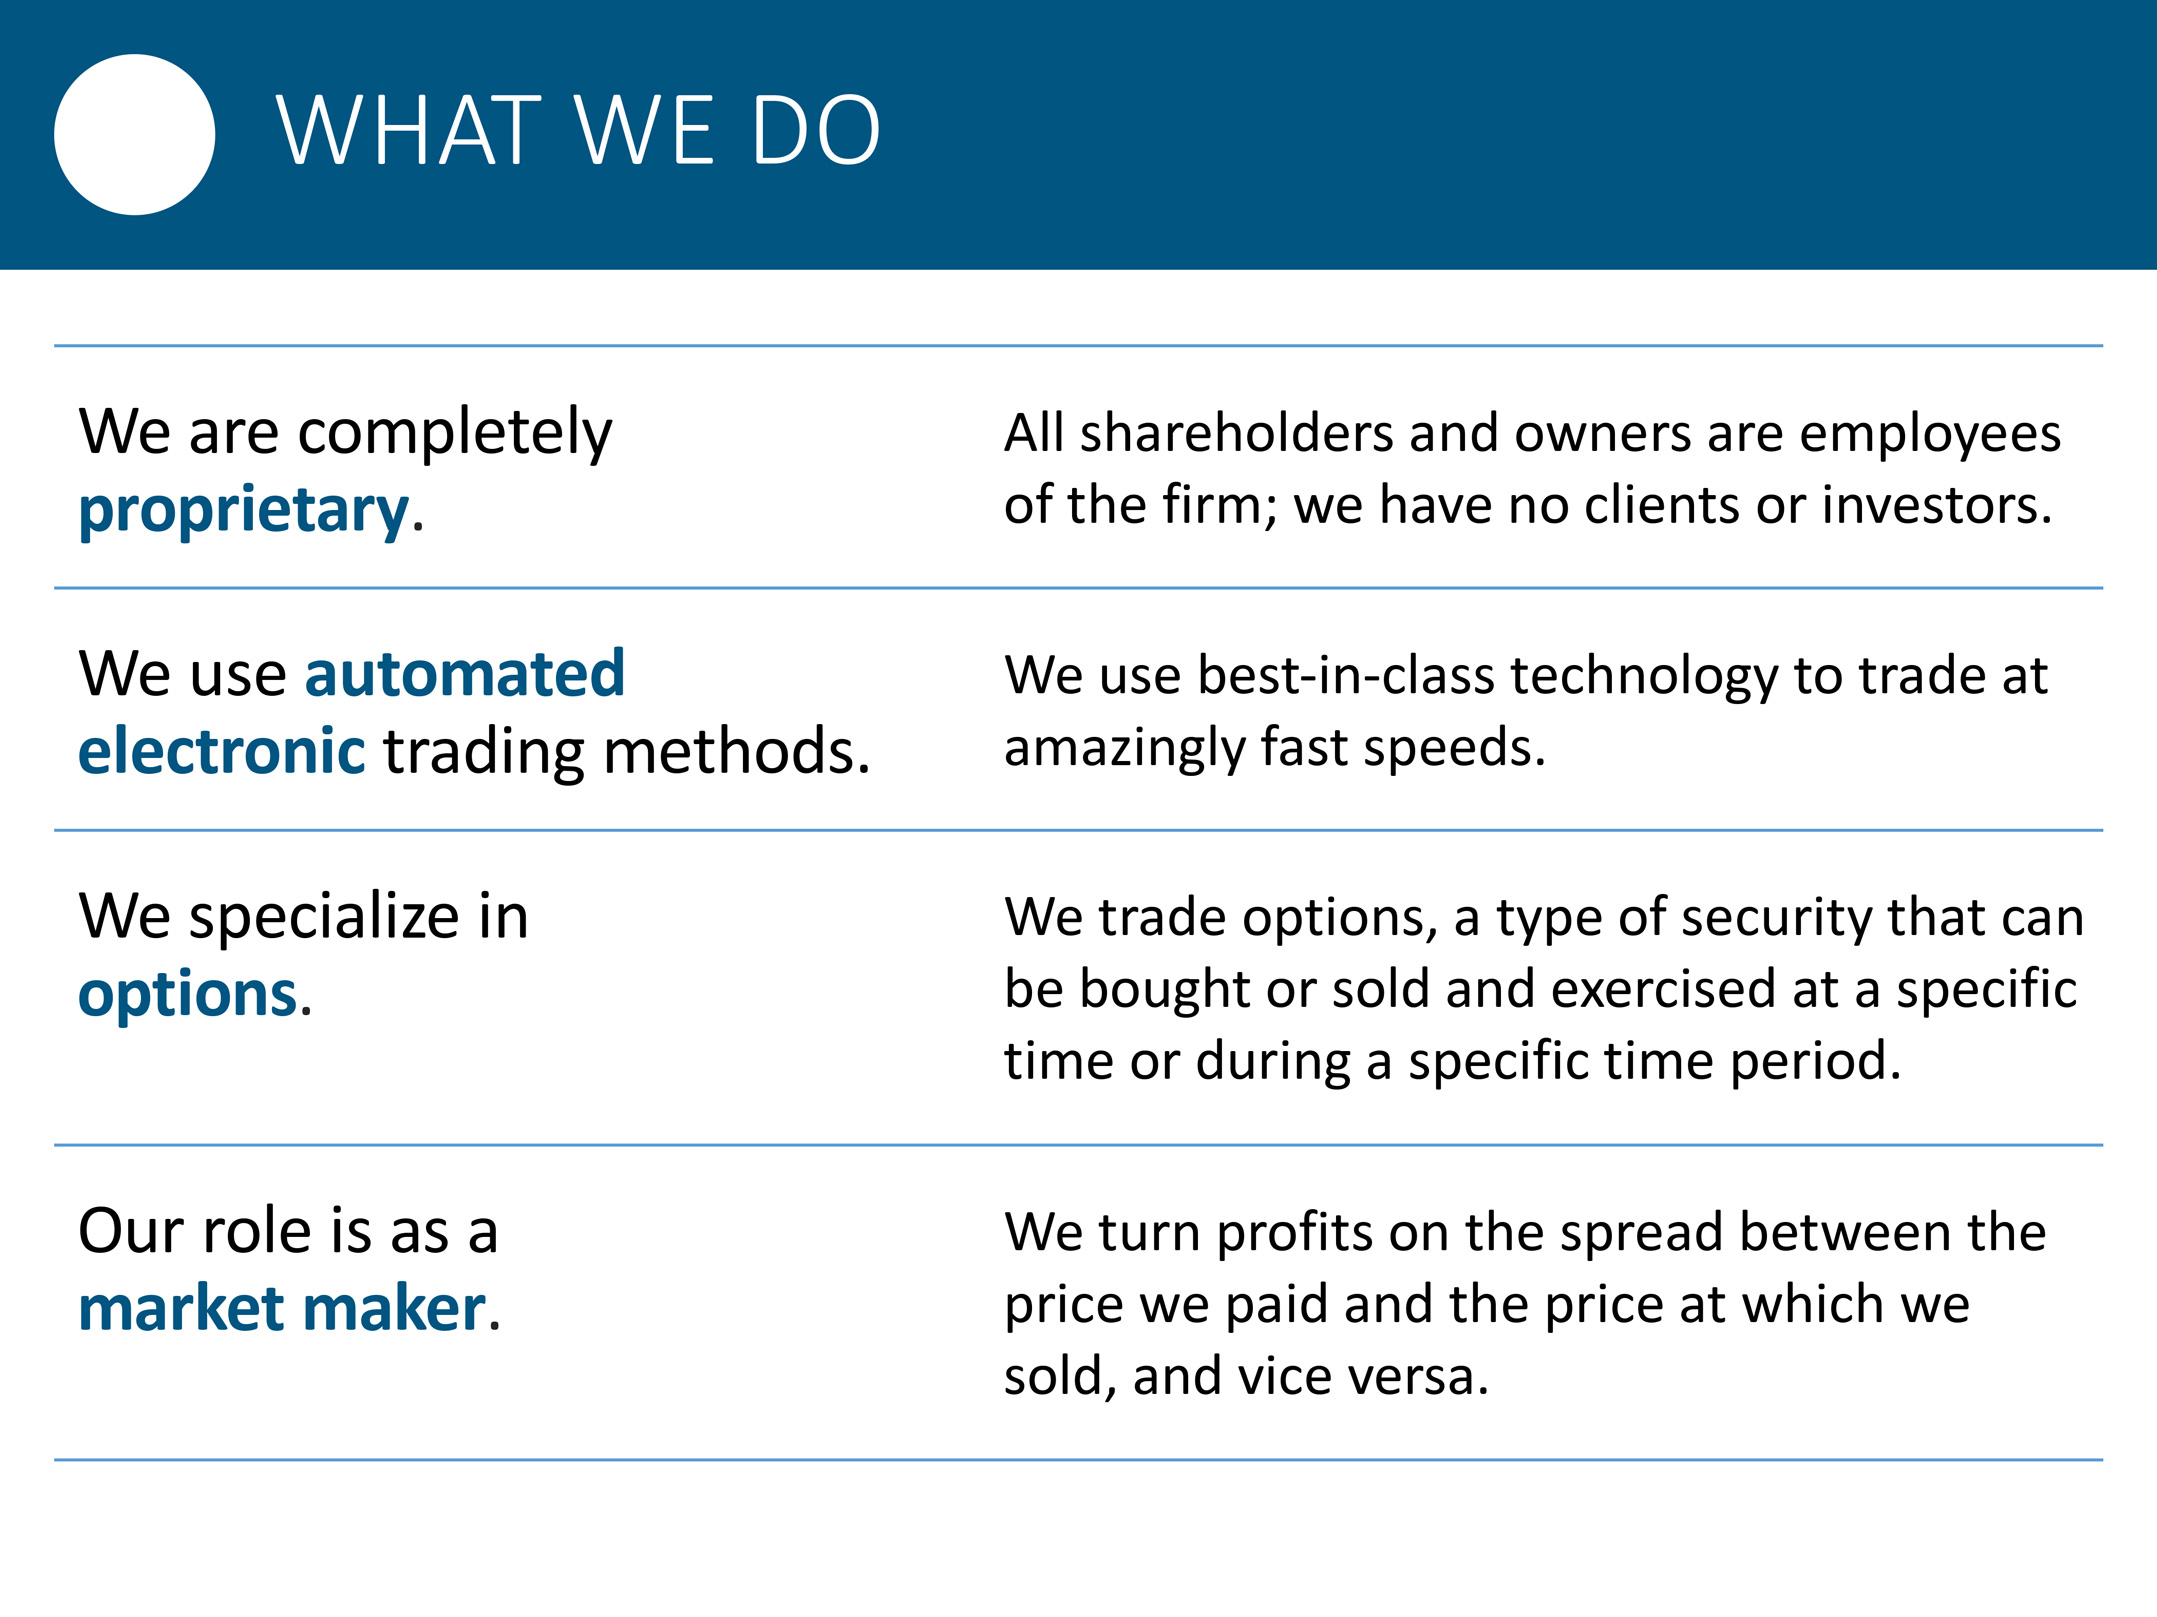
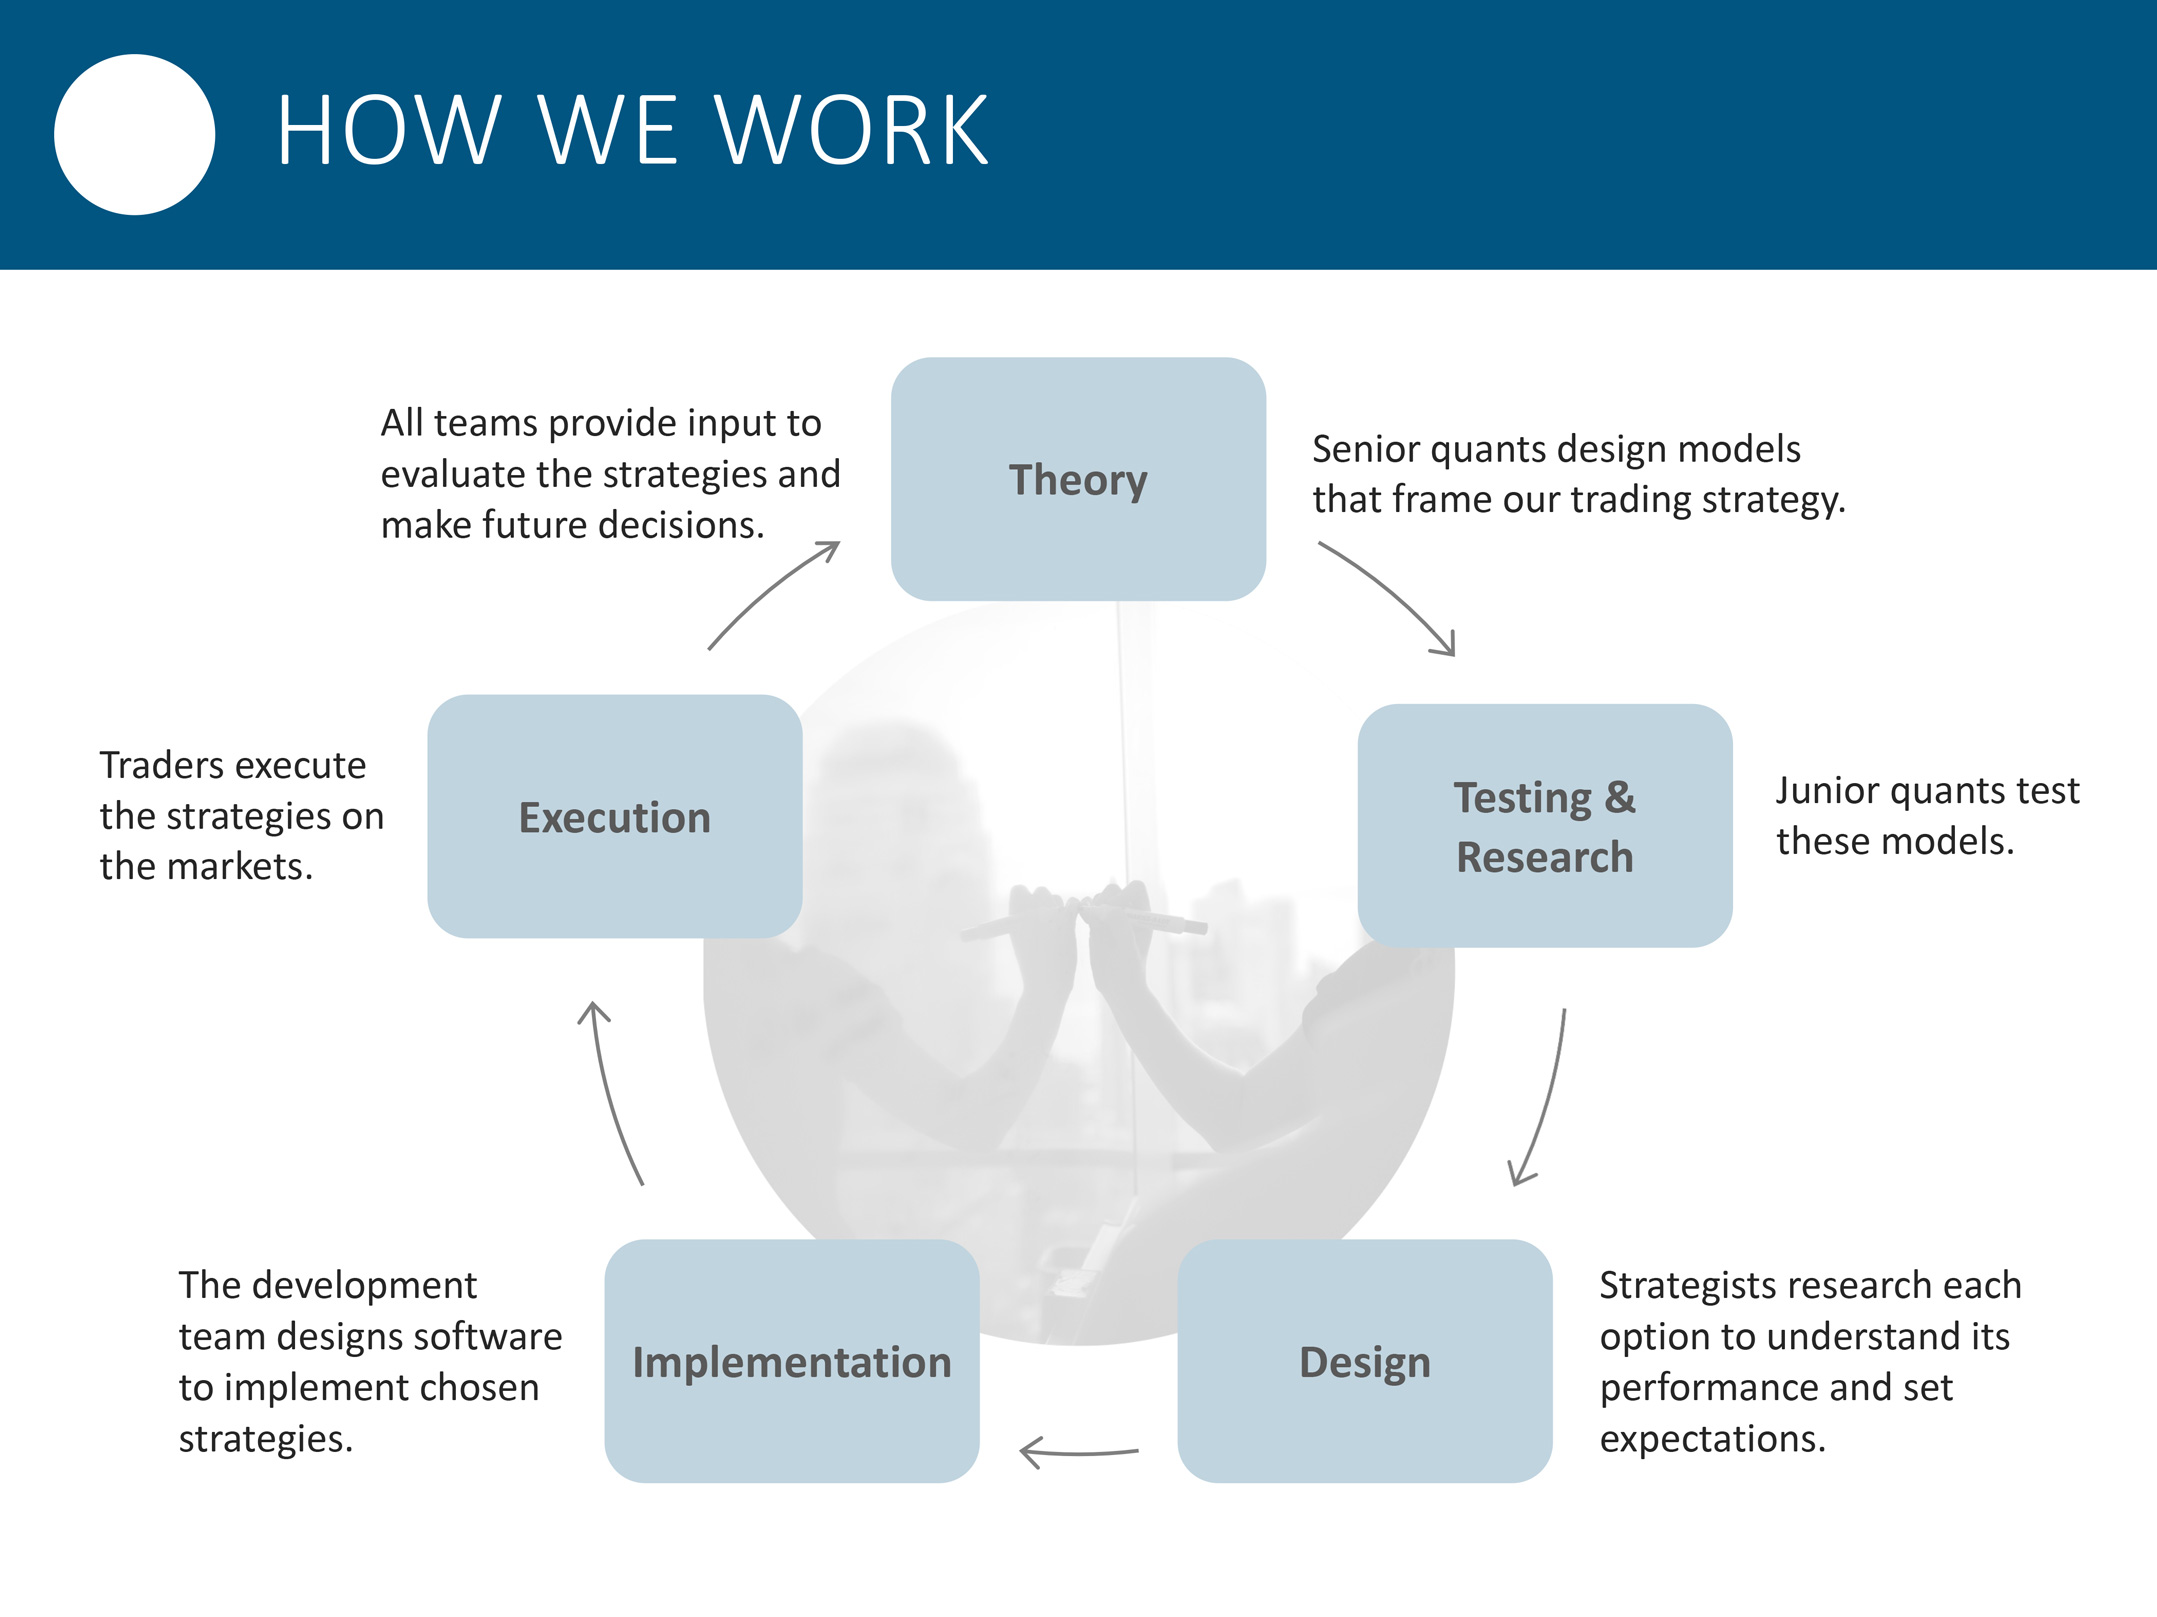
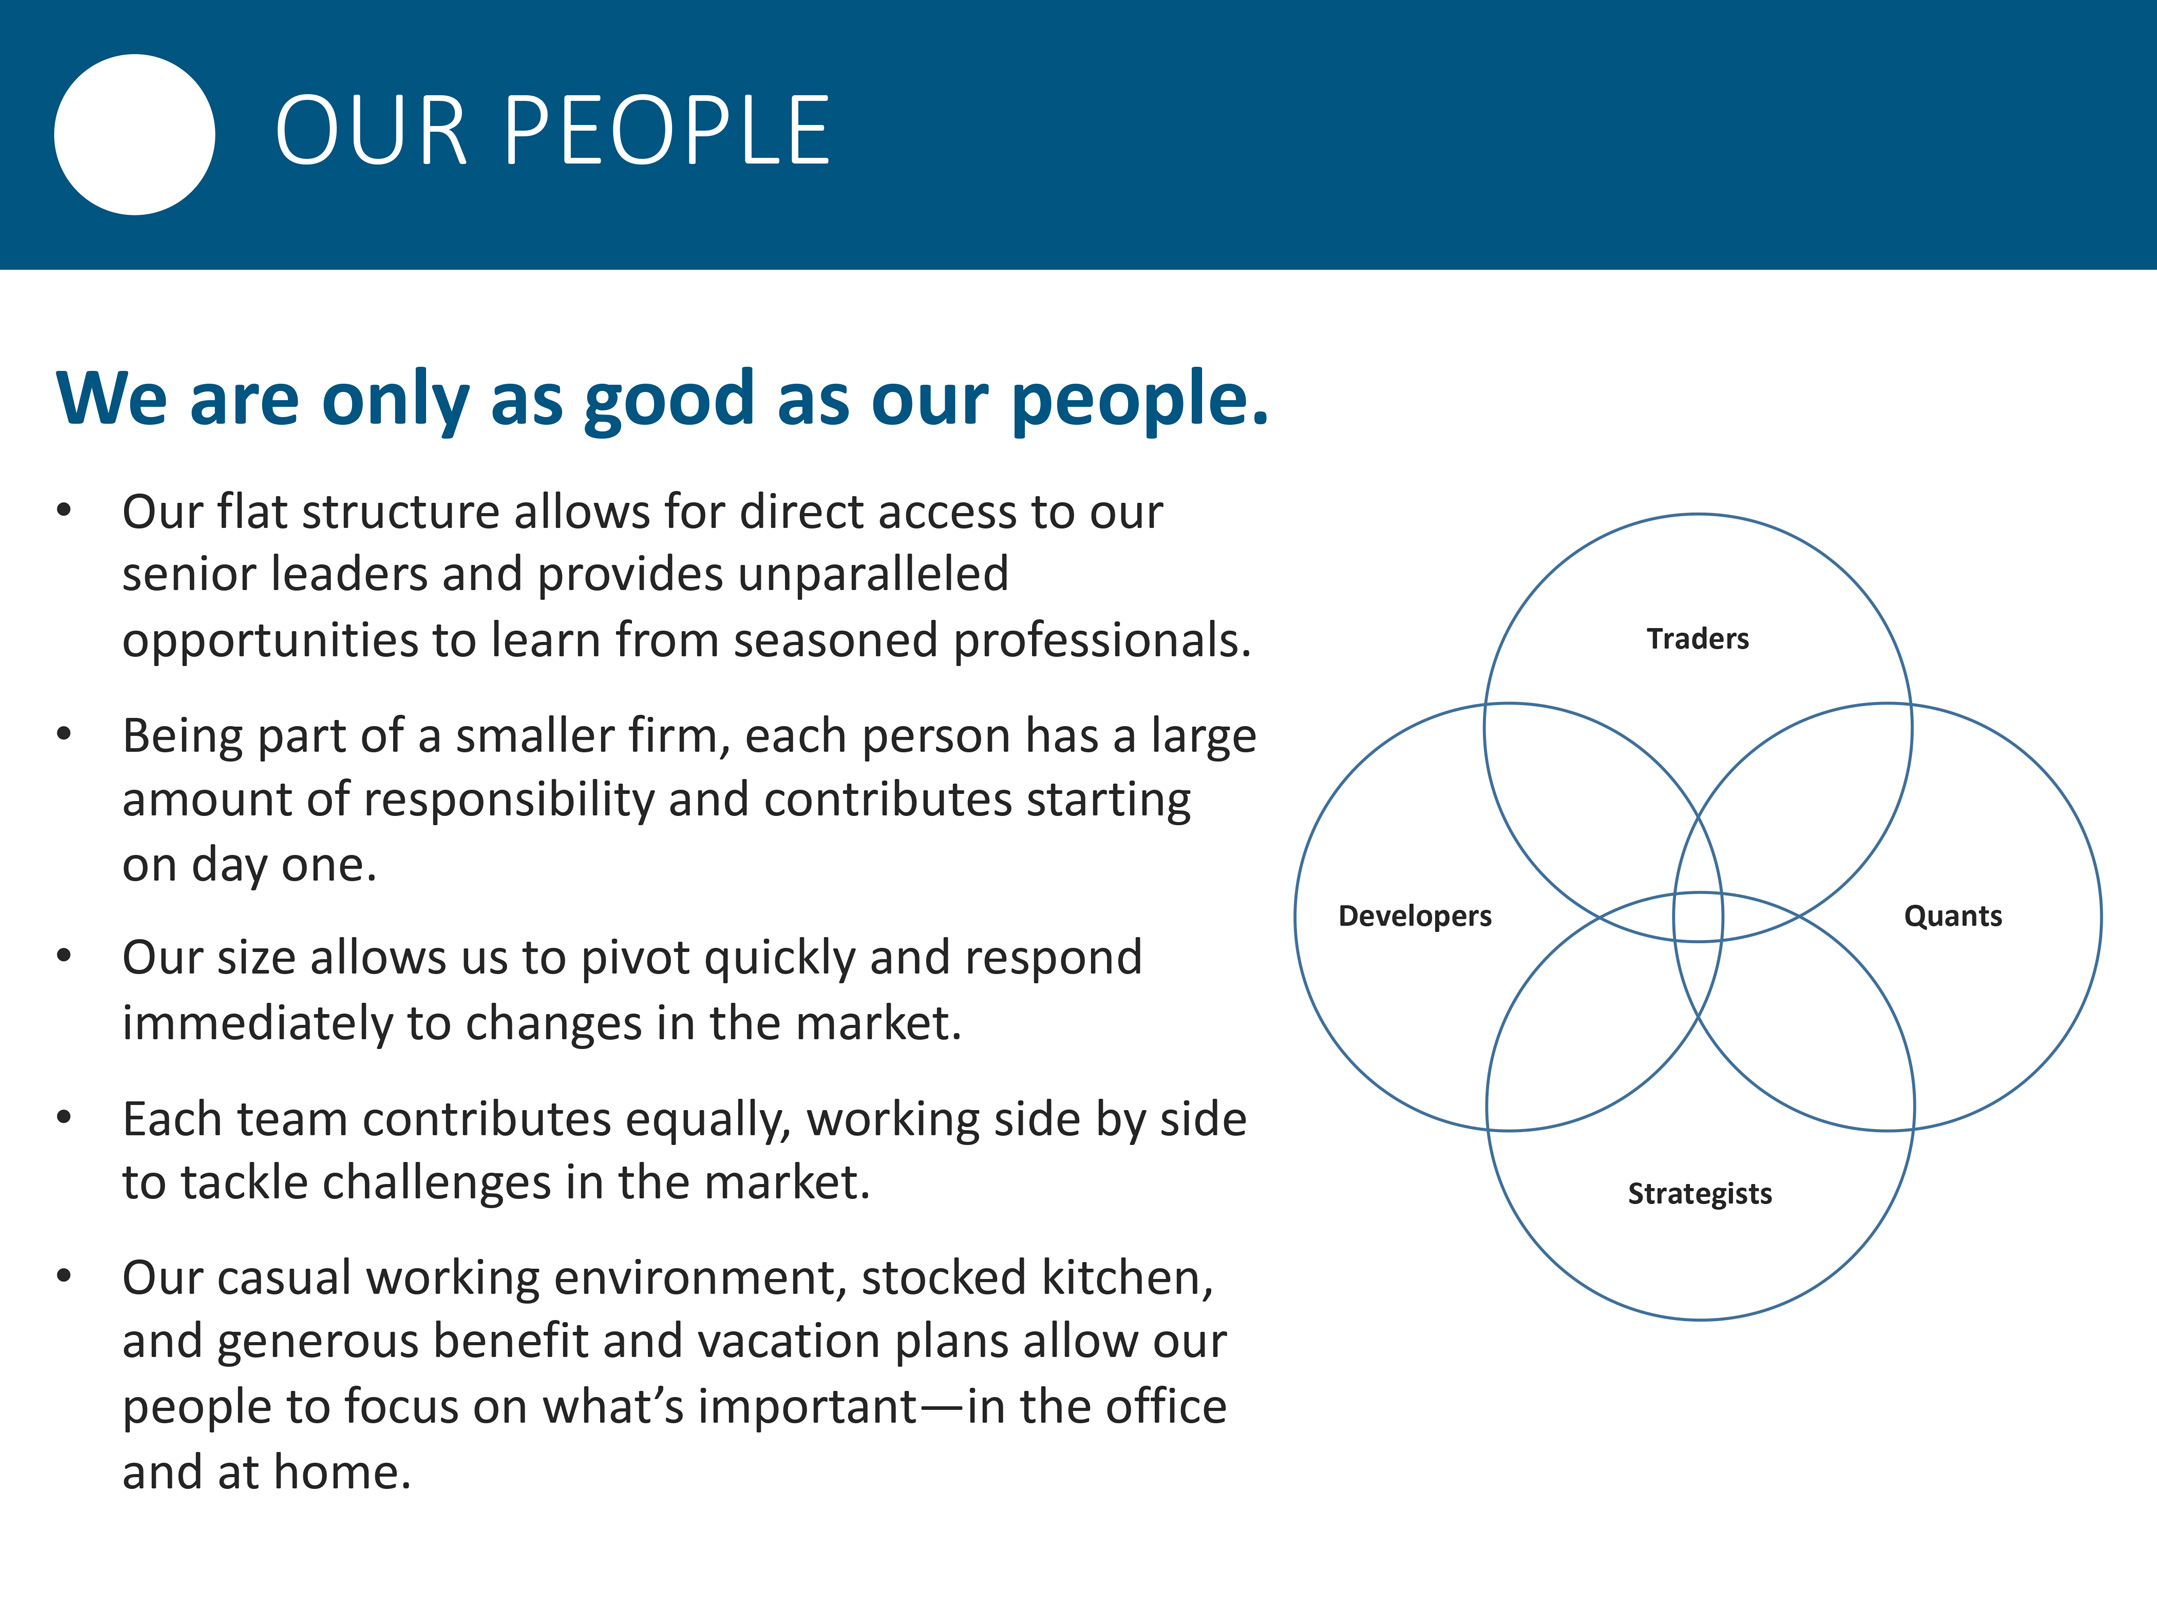
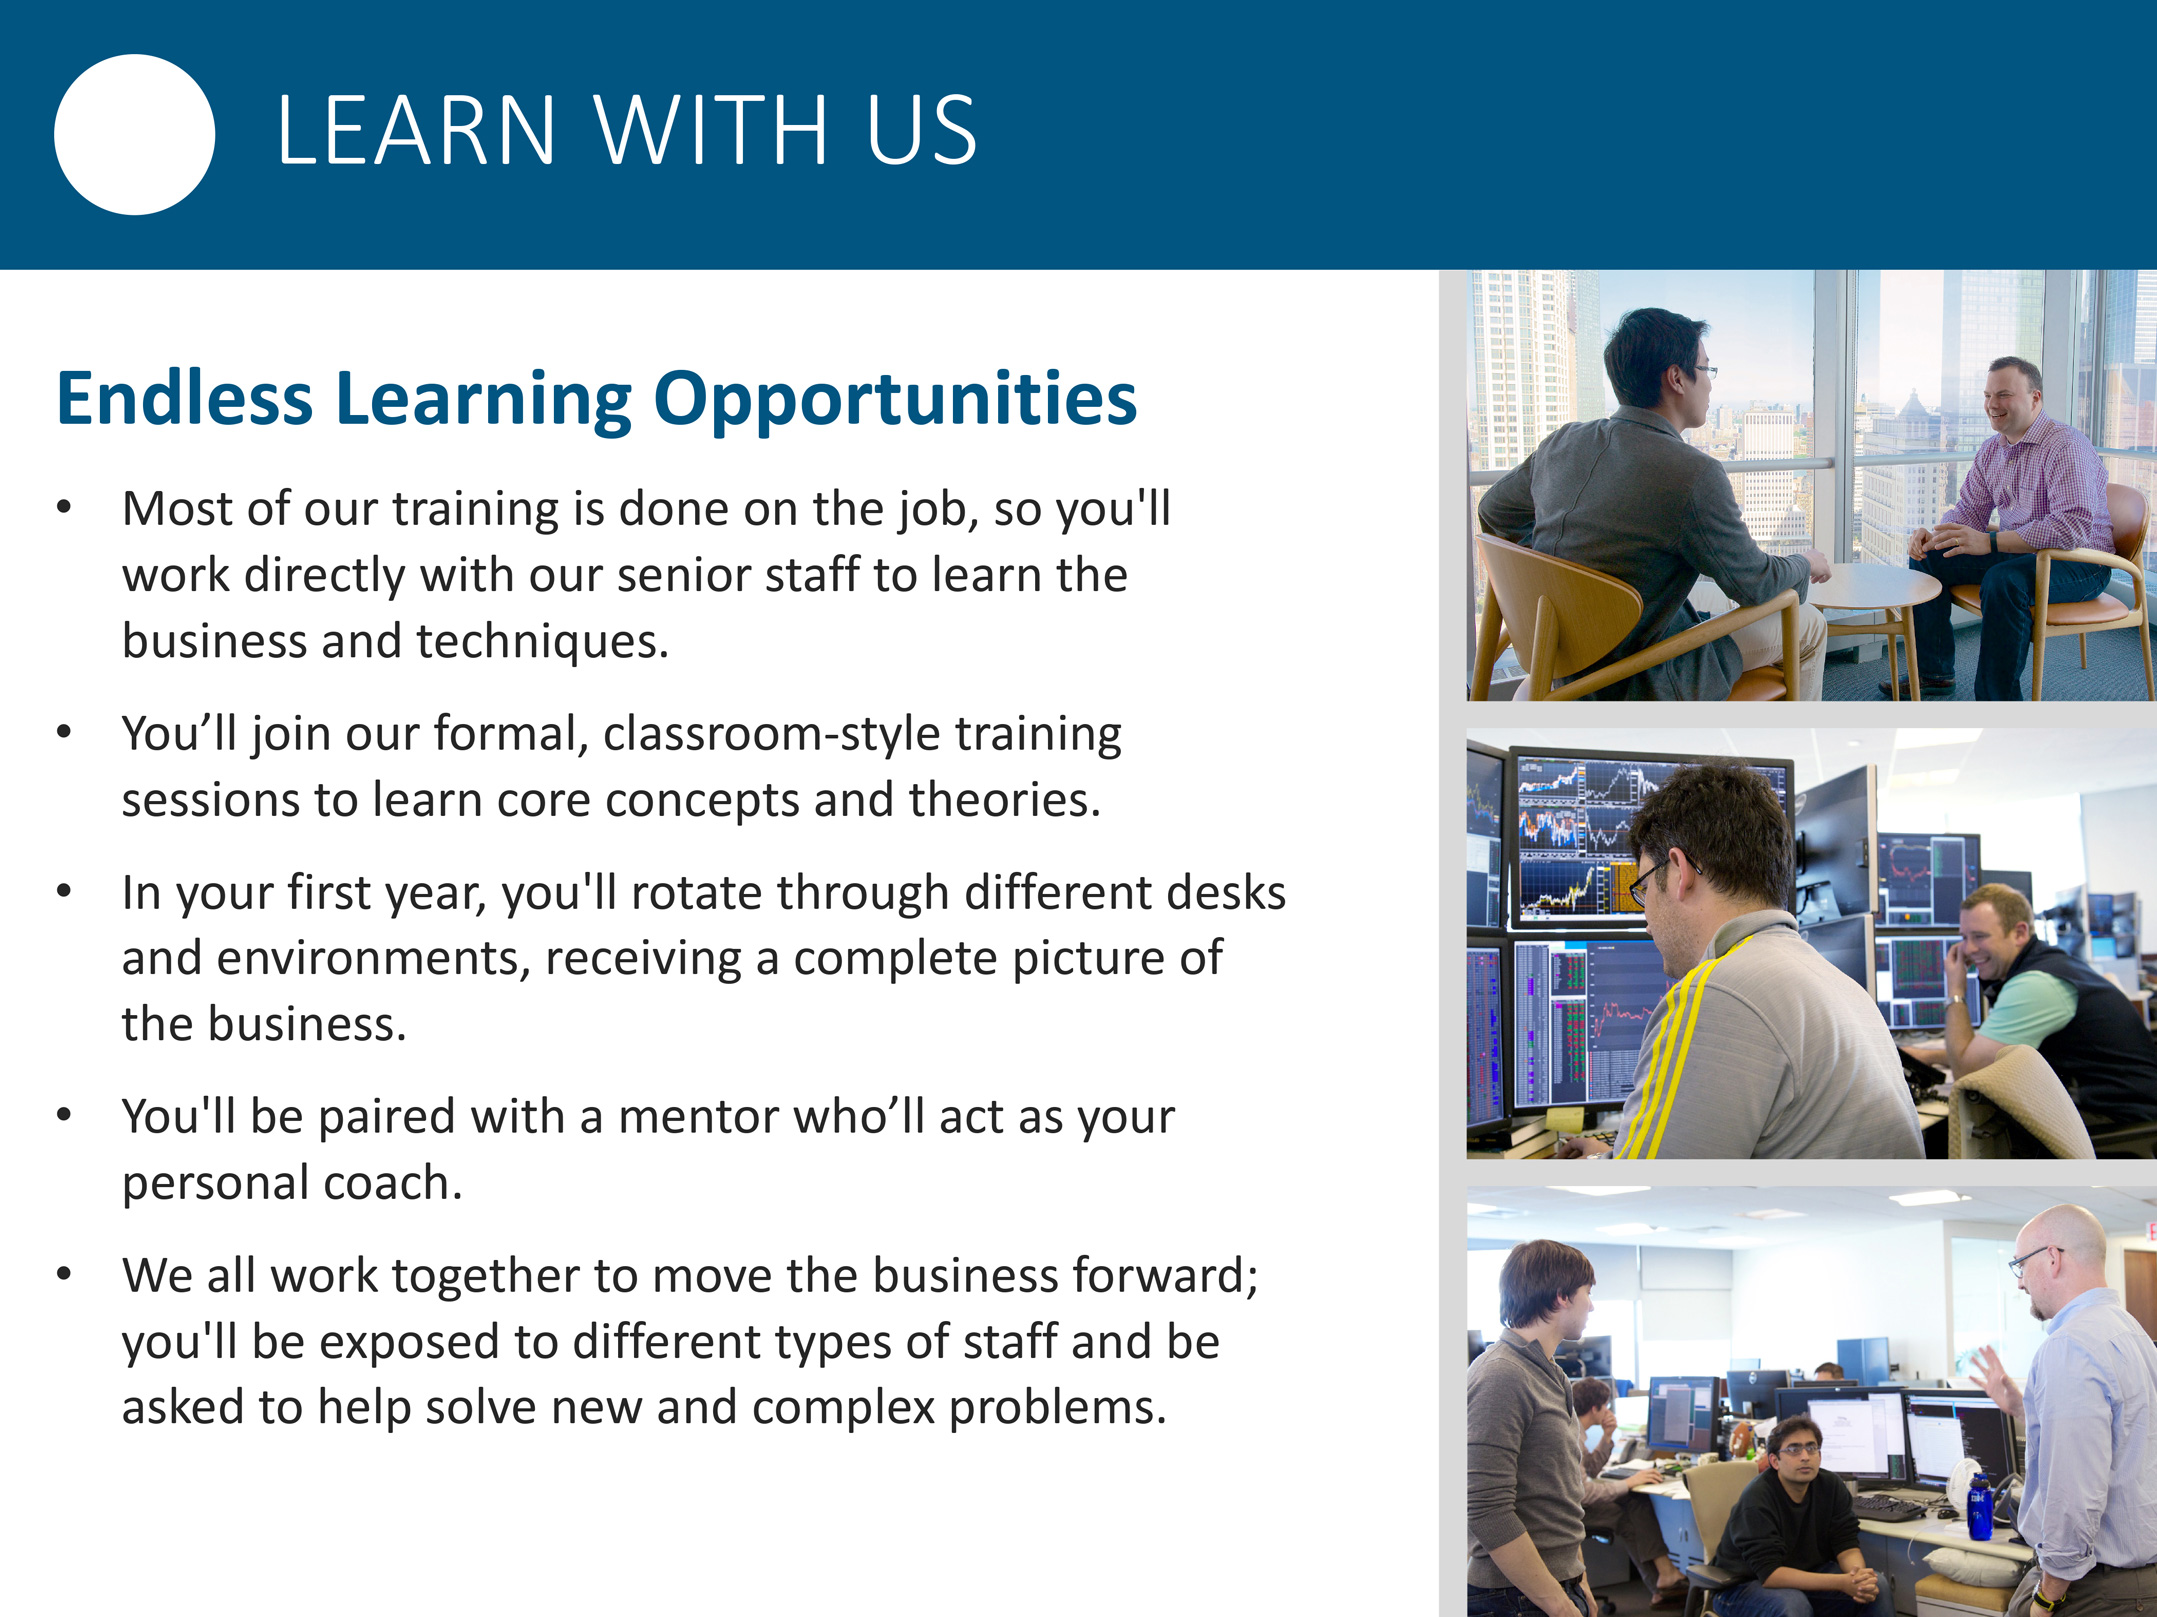
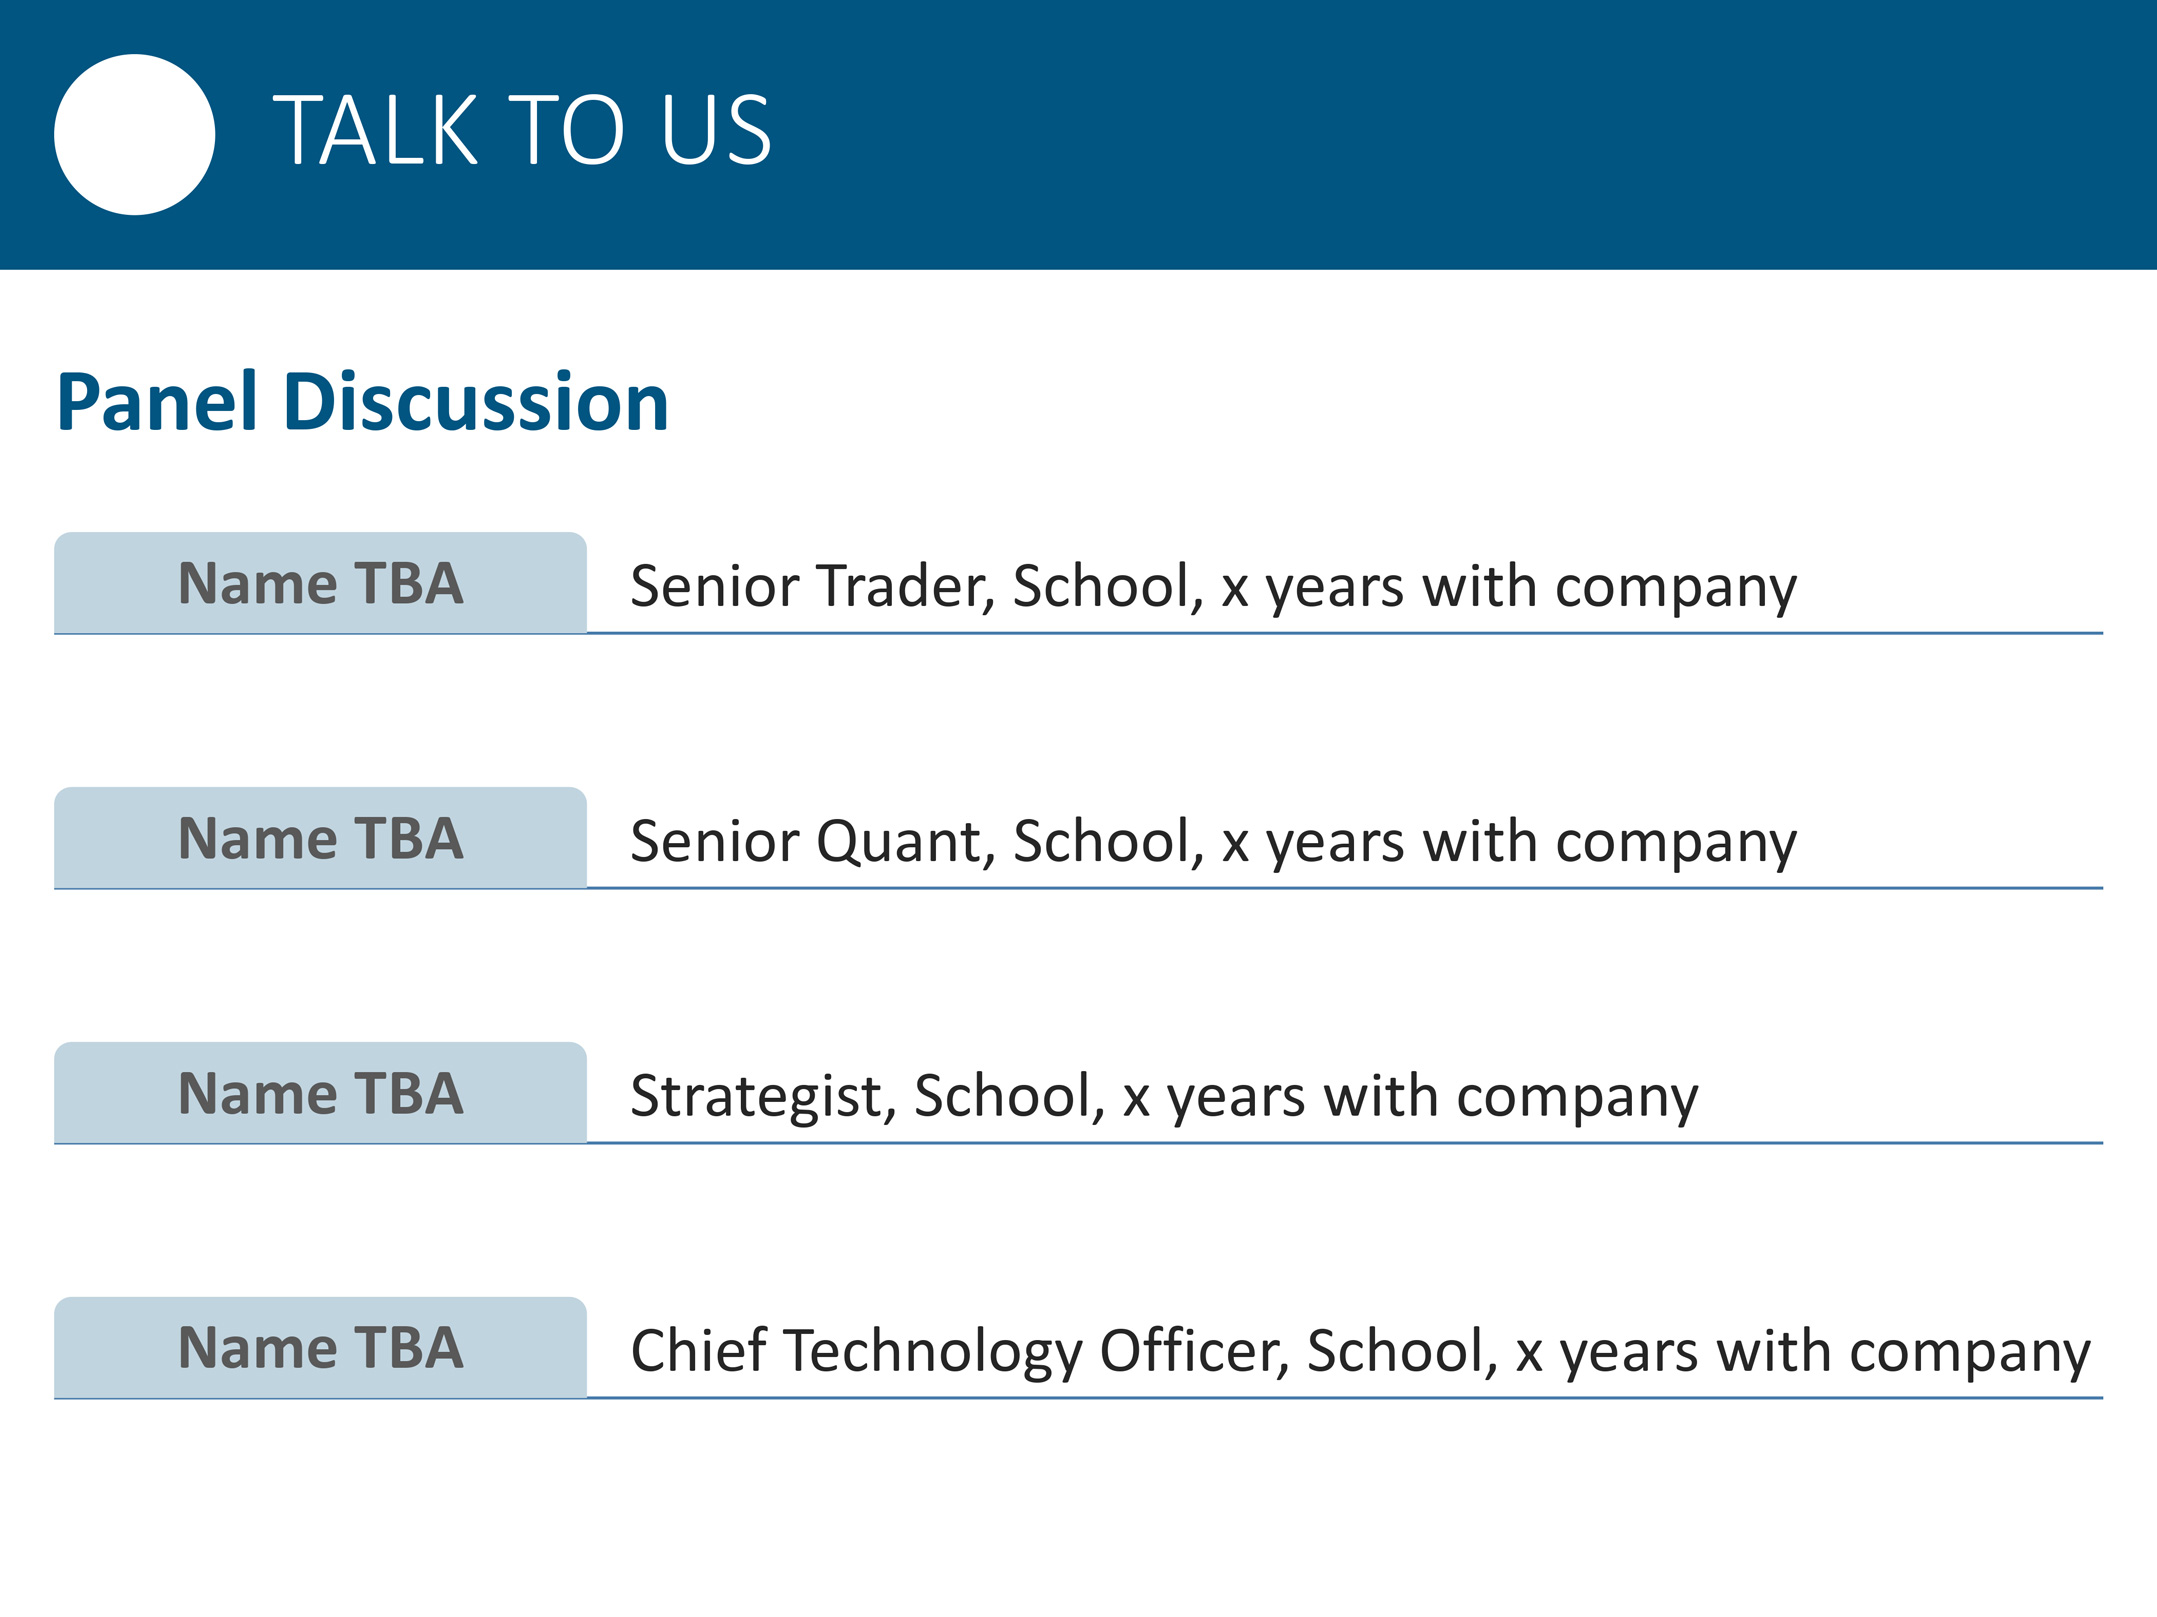
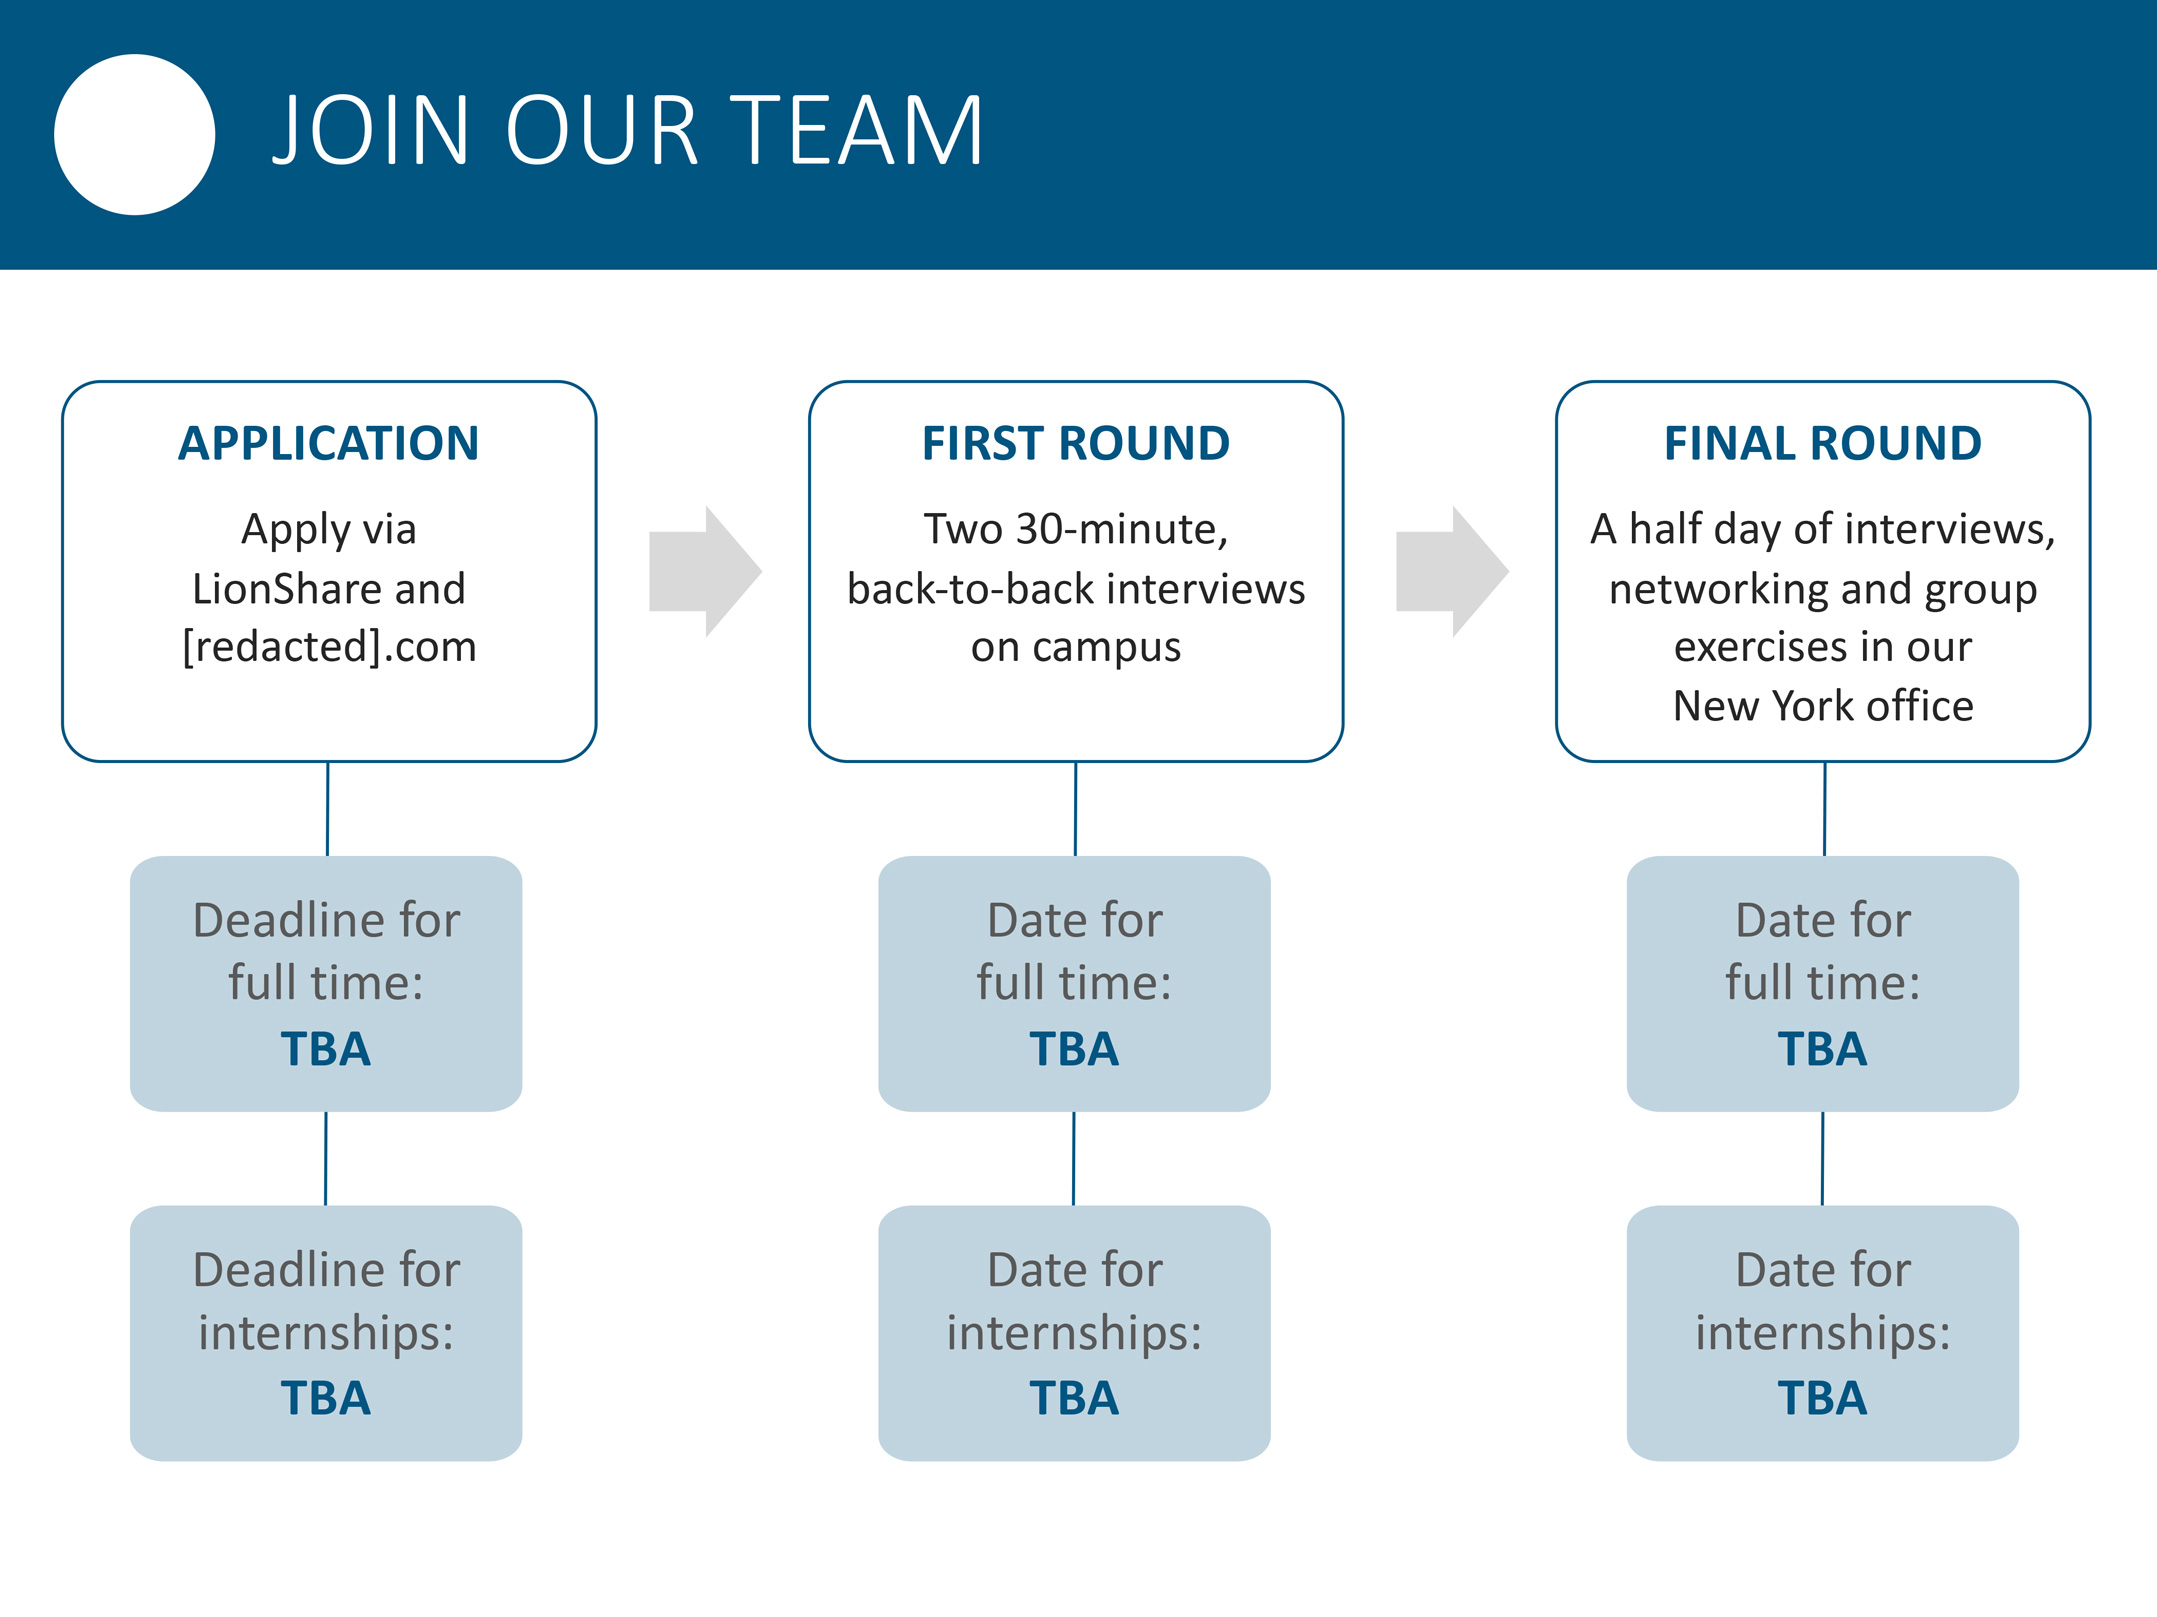
Options-Trading Company

I developed a set of PowerPoint slides for an options-trading firm (name and logo removed for anonymity) to take to college campuses for recruiting. In addition to doing the design, I determined the number and arrangement of slides, edited the client’s copy, and selected and color corrected their photos.

See a side-by-side comparison [pdf] of the client’s original set and my version.

Slide from a presentation design for an options-trading firm. The text begins 'We Make Markets Better,' followed by an overview of the company. Three photos of employees at work run down the right-hand side. Slide from a presentation design for an options-trading firm. Titled 'What We Do,' the slide includes summary statements on the left-hand side and explanations on the right. Slide from a presentation design for an options-trading firm. A circular flow chart lists the company's functions: theory, testing and research, design, implementation, and execution. A description is next to each function. A semi-transparent photo of a woman writing on a board sits in the center of the chart. Slide for an options-trading firm. The slide begins with a statement: 'We are only as good as our people.' Bullet points follow. On the right-hand side is a Venn diagram listing roles: traders, quants, strategists, and developers. Slide for an options-trading firm. The slide begins with a title: 'Endless Learning Opportunities.' Bullet points follow. Three photos of employees at work run down the right-hand side. Slide for an options-trading firm. The slide is a boilerplate for a panel discussion, to be filled in with names and titles of panelists. Slide for an options-trading firm. The slide begins with a statement: 'We are hiring high-performance students to join us.' Job descriptions follow. Three photos of employees at work run down the right-hand side. Slide for an options-trading firm. The slide is a flow chart outlining the interview process, with descriptions and deadlines for the application process and two rounds of interviews.